Low Frequency Rheological Testing for Hydrolyzed Fraction Identification in Resins
Low frequency oscillatory rheology unmask hydrolyzed resin fractions by measuring zero-shear viscosity drop and storage modulus slope collapse near zero frequency.


Terminal
When exposed to moisture during melt processing, condensation polymers like polyethylene terephthalate and polyamide 66 undergo hydrolytic chain cleavage. Standard quality control relies heavily on melt flow rate measurements from capillary shear or single-load extrusion devices, but routine melt index tests fail to capture shorter chains. Because capillary rheometry and melt flow indexers run at high shear rates ~ typically above 100 reciprocal seconds ~ or under heavy static extrusion loads, non-Newtonian shear thinning aligns the polymer chains and masks how low-molecular-weight fragments alter fluid dynamics.

Molecular Scission Dynamics in Condensation Polymers
At elevated compounding temperatures, trace moisture rapidly cleaves ester and amide bonds along the polymer backbone, converting long entangled macromolecules into shorter fragments and broadening the polydispersity index toward lower molecular weights. High-shear rheological testing compresses the observed differences between virgin and degraded resins because strong shear forces disentangle chains regardless of length. By contrast, small-amplitude oscillatory shear testing near zero angular frequency probes the polymer in an unperturbed state where chains retain their equilibrium random-coil conformations, unmasking subtle variations in chain architecture.
Zero-shear viscosity governs terminal viscoelastic behavior, scaling with weight-average molecular weight through a power-law relationship. For linear polymers above their critical entanglement threshold, this viscosity scales to roughly the 3.4 power of weight-average molecular weight. Consequently, even mild hydrolytic cleavage that reduces overall molecular weight by only a few percent causes a dramatic, easily measured drop in zero-shear viscosity ~ a change obscured in high-shear regimes where shear thinning dominates.
An unhydrolyzed polyethylene terephthalate melt displays a zero-shear viscosity of 320 Pa·s at 275 °C, dropping below 110 Pa·s when hydrolyzed fraction content reaches 1.5 percent by weight.

Zero Shear Limits and Terminal Viscosity Scaling
At very low deformation rates, polymer chains move via reptation without orienting along the flow field. In this terminal zone, storage modulus scales with the square of angular frequency, while loss modulus scales linearly with frequency. Cleaved chains disrupt these slopes: low-molecular-weight fragments introduce fast relaxation modes that accelerate energy dissipation, pulling the storage modulus exponent from its theoretical value of 2.0 down to between 1.2 and 1.5.
This sensitivity makes it possible to detect partial degradation long before macro-scale mechanical tests indicate failure.
Undetected hydrolyzed fractions compromise melt strength and long-term durability in structural parts, giving rise to several key failure modes in production resins:
- Environmental stress cracking accelerates as short hydrolyzed chains migrate to the surface, lowering the energy threshold for chemical attack under stress.
- Creep compliance expansion occurs under sustained loads because entanglement density throughout the degraded matrix is reduced.
- Impact strength loss shows up as a sharp shift from ductile to brittle failure during high-rate loading.
- Die swell reduction during profile extrusion leads to poor dimensional control and uneven wall thickness in hollow shapes.
| Resin Condition | Zero-Shear Viscosity (Pa·s) | Storage Modulus Slope at 0.01 rad/s | Loss Factor at 0.05 rad/s | Weight-Average MW (g/mol) |
|---|---|---|---|---|
| Virgin Pellet Lot | 345 | 1.94 | 0.42 | 28,500 |
| Hydrolyzed 0.5% Water | 210 | 1.62 | 0.78 | 24,200 |
| Hydrolyzed 1.5% Water | 108 | 1.31 | 1.45 | 19,800 |
| Hydrolyzed 3.0% Water | 42 | 1.08 | 2.88 | 14,100 |
Allowing resin lots with hydrolyzed fractions into production results in premature mechanical failure under sustained creep and unexpected brittle cracking during drop tests of molded housings.

Melt
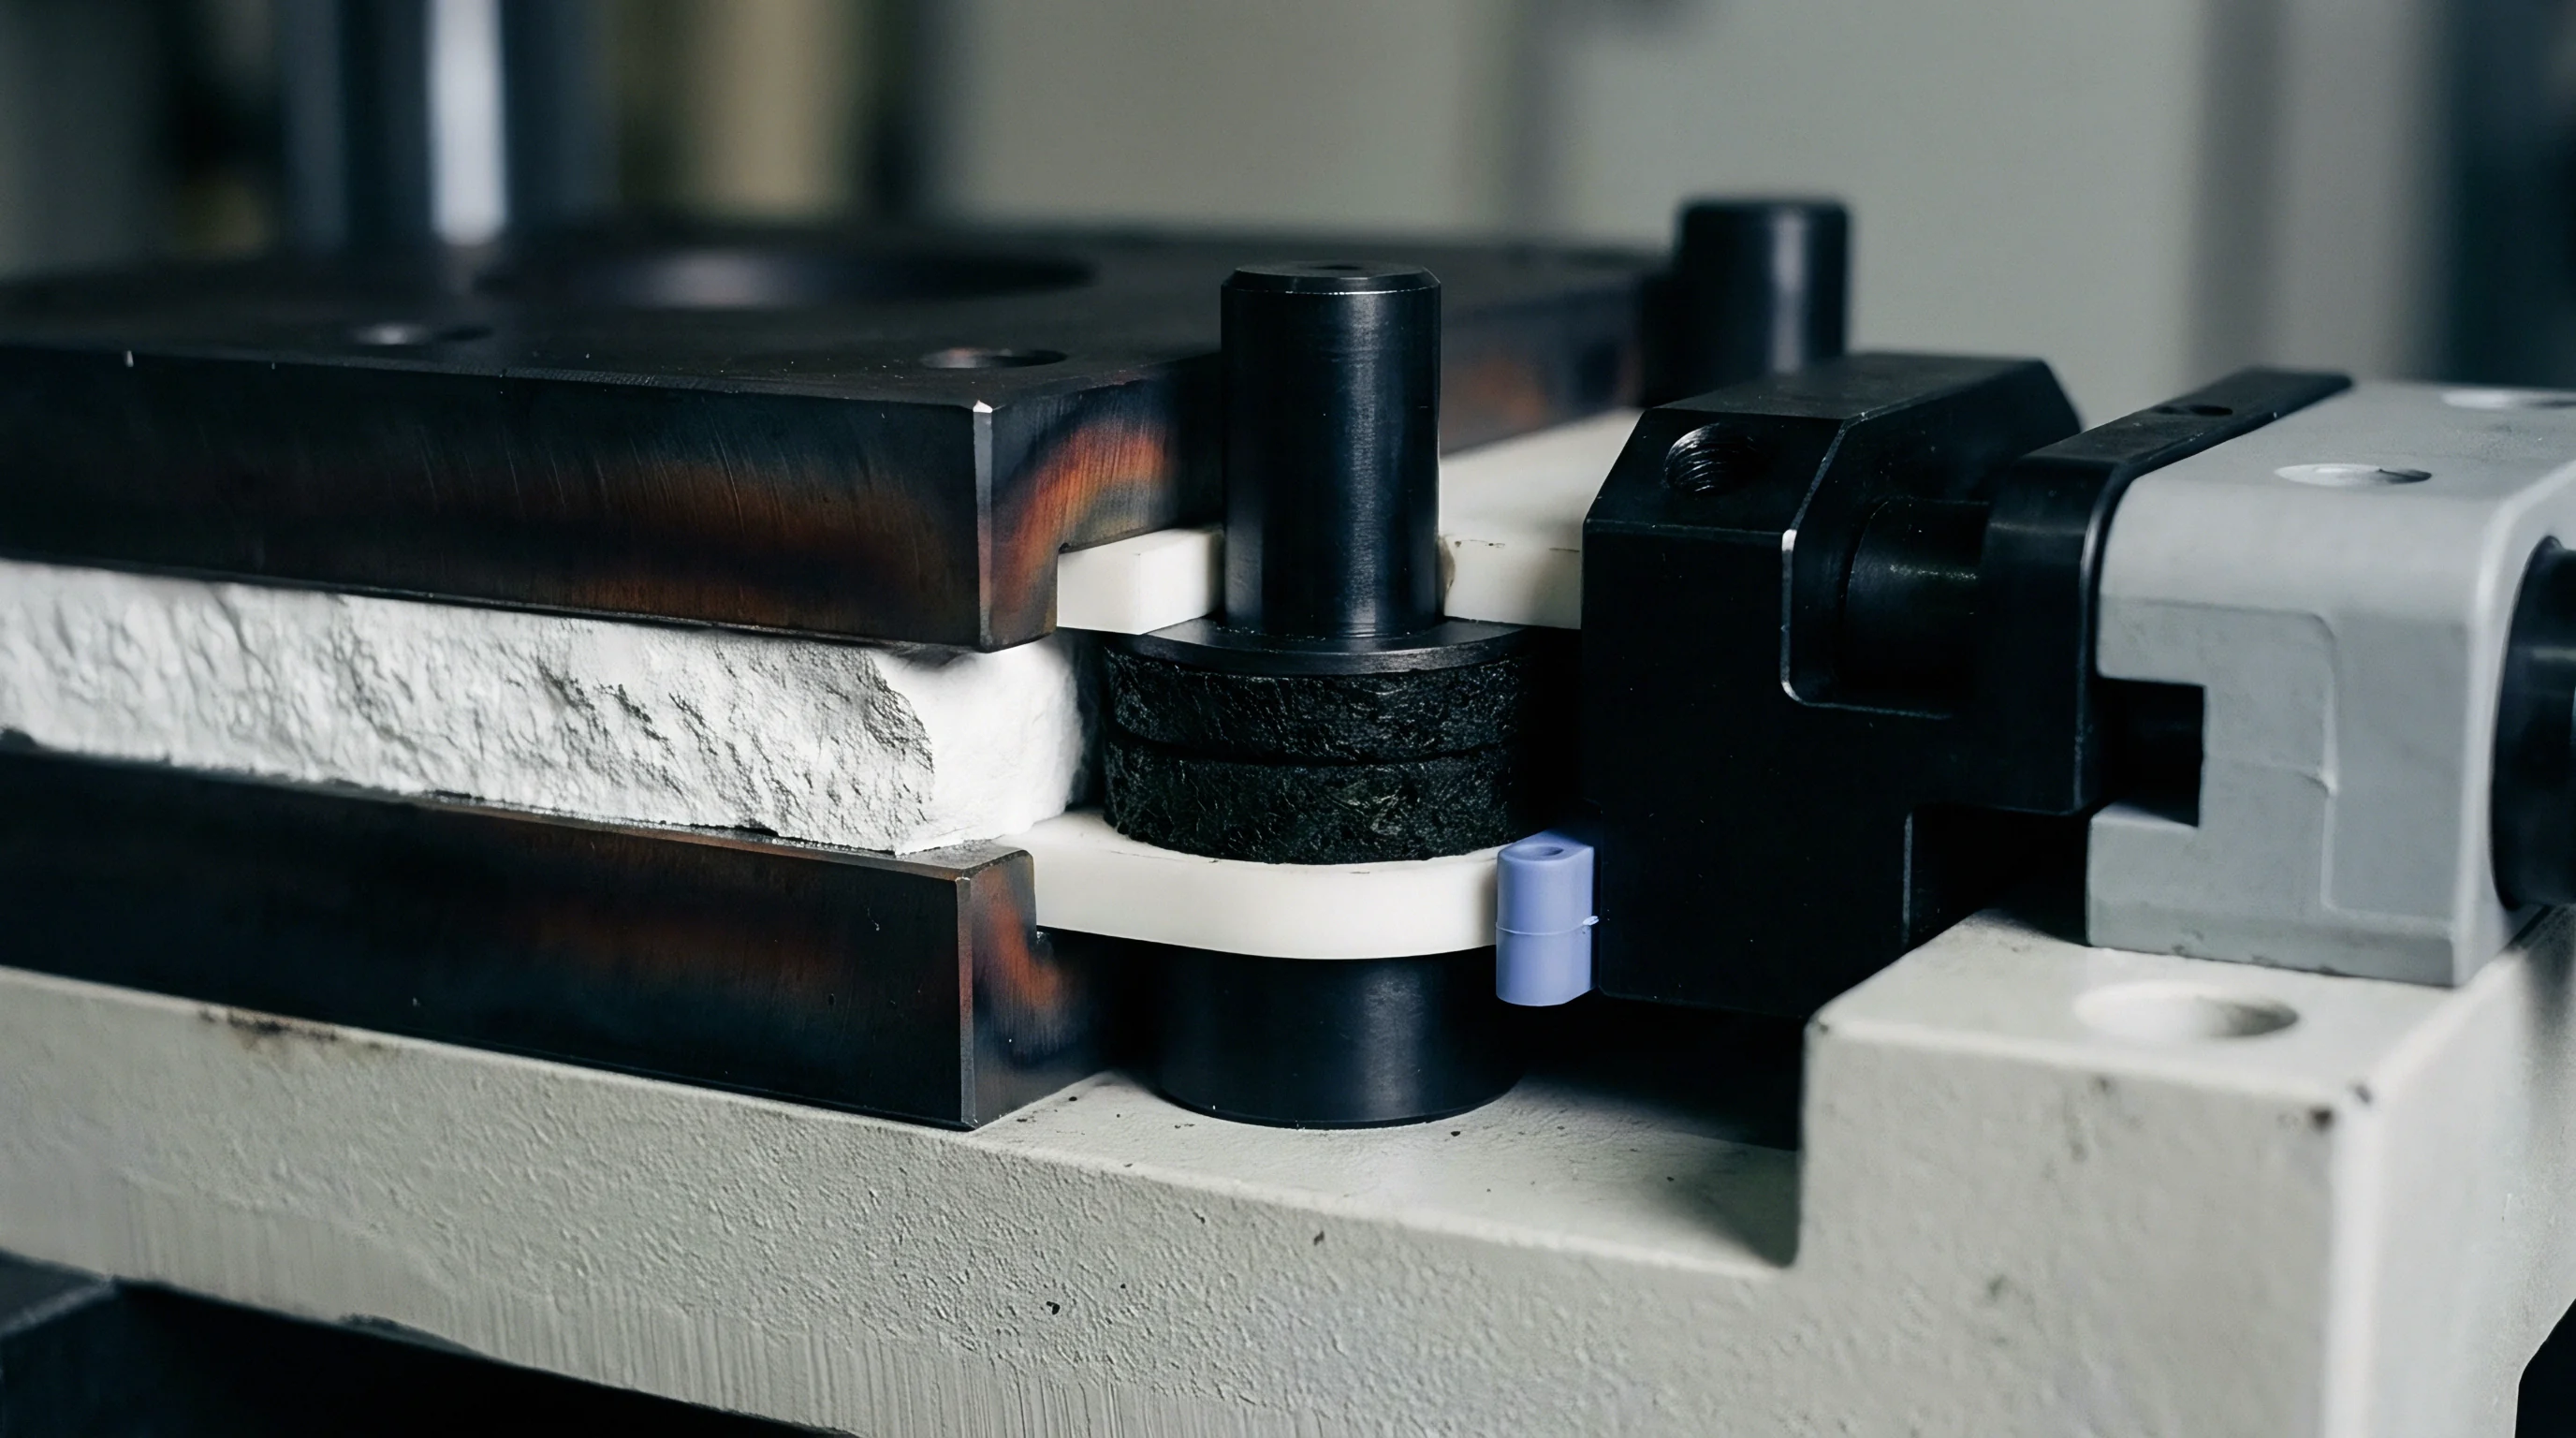
Rotational oscillatory rheometry tracks structural changes in high-performance resins under controlled thermal conditions. Testing requires strict atmospheric control to prevent secondary degradation during measurement; in moisture-sensitive polymers such as polyamides or polyesters, residual moisture inside the sample pan drives additional hydrolysis during a frequency sweep. A properly isolated test environment preserves the initial hydrolytic state without introducing sample preparation artifacts.

Parallel Plate Geometry and Thermal Stability Windows
Testing sensitive condensation resins requires precise temperature control and an inert nitrogen purge to prevent thermal oxidation. Parallel-plate geometries with 25-millimeter diameters and gaps between 1.0 and 1.5 millimeters provide the standard setup for linear viscoelastic measurements, provided edge errors are minimized through clean sample trimming. The gap setting must account for thermal expansion of stainless steel or invar fixtures as they heat to testing temperatures, since incorrect gap calibration corrupts modulus calculations at low frequencies.
Sample preparation directly governs data integrity. Pellets require deep vacuum drying below strict moisture limits ~ under 30 parts per million for polyethylene terephthalate and under 200 parts per million for polyamides ~ prior to loading. Transferring resin into the preheated fixture must take less than two minutes to limit moisture uptake.
Once loaded and trimmed, running a 20-minute time sweep at a fixed frequency of 1.0 radian per second verifies thermal stability; a complex viscosity drift greater than 5 percent signals active degradation or crosslinking, which invalidates subsequent frequency sweeps.
| Polymer Chemistry | Drying Temperature (°C) | Vacuum Duration (Hours) | Max Allowable Moisture (ppm) | Test Stability Limit at 260 °C |
|---|---|---|---|---|
| PET | 160 | 4.0 | 30 | 15 Minutes |
| PBT | 130 | 4.0 | 40 | 20 Minutes |
| PA66 | 80 | 12.0 | 150 | 12 Minutes |
| Polycarbonate | 120 | 3.0 | 50 | 25 Minutes |

Sample Preparation Protocols for Sensitive Condensation Resins
Drying resin under deep vacuum is essential before commencing dynamic testing. Strain sweeps run prior to frequency testing establish the linear viscoelastic limit of the melt. While virgin condensation polymers remain linear up to strain amplitudes of 10 to 15 percent, degraded resins display a much narrower linear region, often requiring strains as low as 1 to 3 percent at low frequencies to prevent structural breakdown during testing.
Parallel-plate gap adjustments made after thermal expansion prevent sample squeeze-out errors during low-shear sweeps.
Melt flow rate variations within published datasheet tolerances are often assumed to ensure full structural compliance, even though low-frequency viscosity drops escape detection.


Curves
Mapping viscoelastic response across a frequency sweep converts raw dynamic modulus data into clear structural diagnostics. Low-frequency measurements expose cleaved polymer chains where phase angles diverge. By focusing on parameters independent of absolute molecular weight or test temperature, these rheological curves enable compounders to identify low-molecular-weight hydrolyzed fractions in incoming resin lots.

Van Gurp-Palmen Plots for Polydispersity Analysis
Plotting phase angle directly against complex modulus isolates shifts in molecular weight distribution without relying on temperature shift factors. Undegraded polymers with narrow distributions show a steady drop in phase angle as complex modulus rises, eventually leveling off at high modulus values. Hydrolyzed fragments disrupt this trend, pushing the phase angle upward in the low-to-intermediate modulus range between 100 Pa and 10,000 Pa.
This upward shift occurs because short, cleaved chains relax rapidly, dissipating energy as heat rather than storing it elastically. On a Van Gurp-Palmen plot, a partially hydrolyzed resin shows a noticeable inflection point or secondary plateau at low modulus values. The extent of this deviation from the virgin baseline directly reflects the mass fraction of degraded chains in the resin.
ISO 6721-10 testing at frequencies below 0.05 radians per second identifies low-molecular-weight fractions that pass standard melt flow rate verification under ASTM D1238.

Cole-Cole Relaxation Spectra and Bimodal Molecular Distributions
Plotting the imaginary component of complex viscosity against the real component yields a clear graphic signature of polymer health. Undegraded linear polymers produce a single, smooth arc in Cole-Cole space. Hydrolytic cleavage splits this relaxation behavior across distinct timescales, distorting the arc into an asymmetric shape or introducing a secondary shoulder at lower viscosity values.
In Cole-Cole plots, long relaxation times from intact chains define the high-viscosity apex, while short relaxation times from hydrolyzed fragments form a tail extending toward the origin. Distortions in arc shape allow quality control labs to distinguish uniform thermal degradation ~ which drops the entire curve downward ~ from wet-processing hydrolytic scission, which disrupts arc symmetry.
An upward inflection in the low-modulus region of a phase angle curve signals chain scission well before high-shear viscosity measurements show any noticeable change.


Sieve
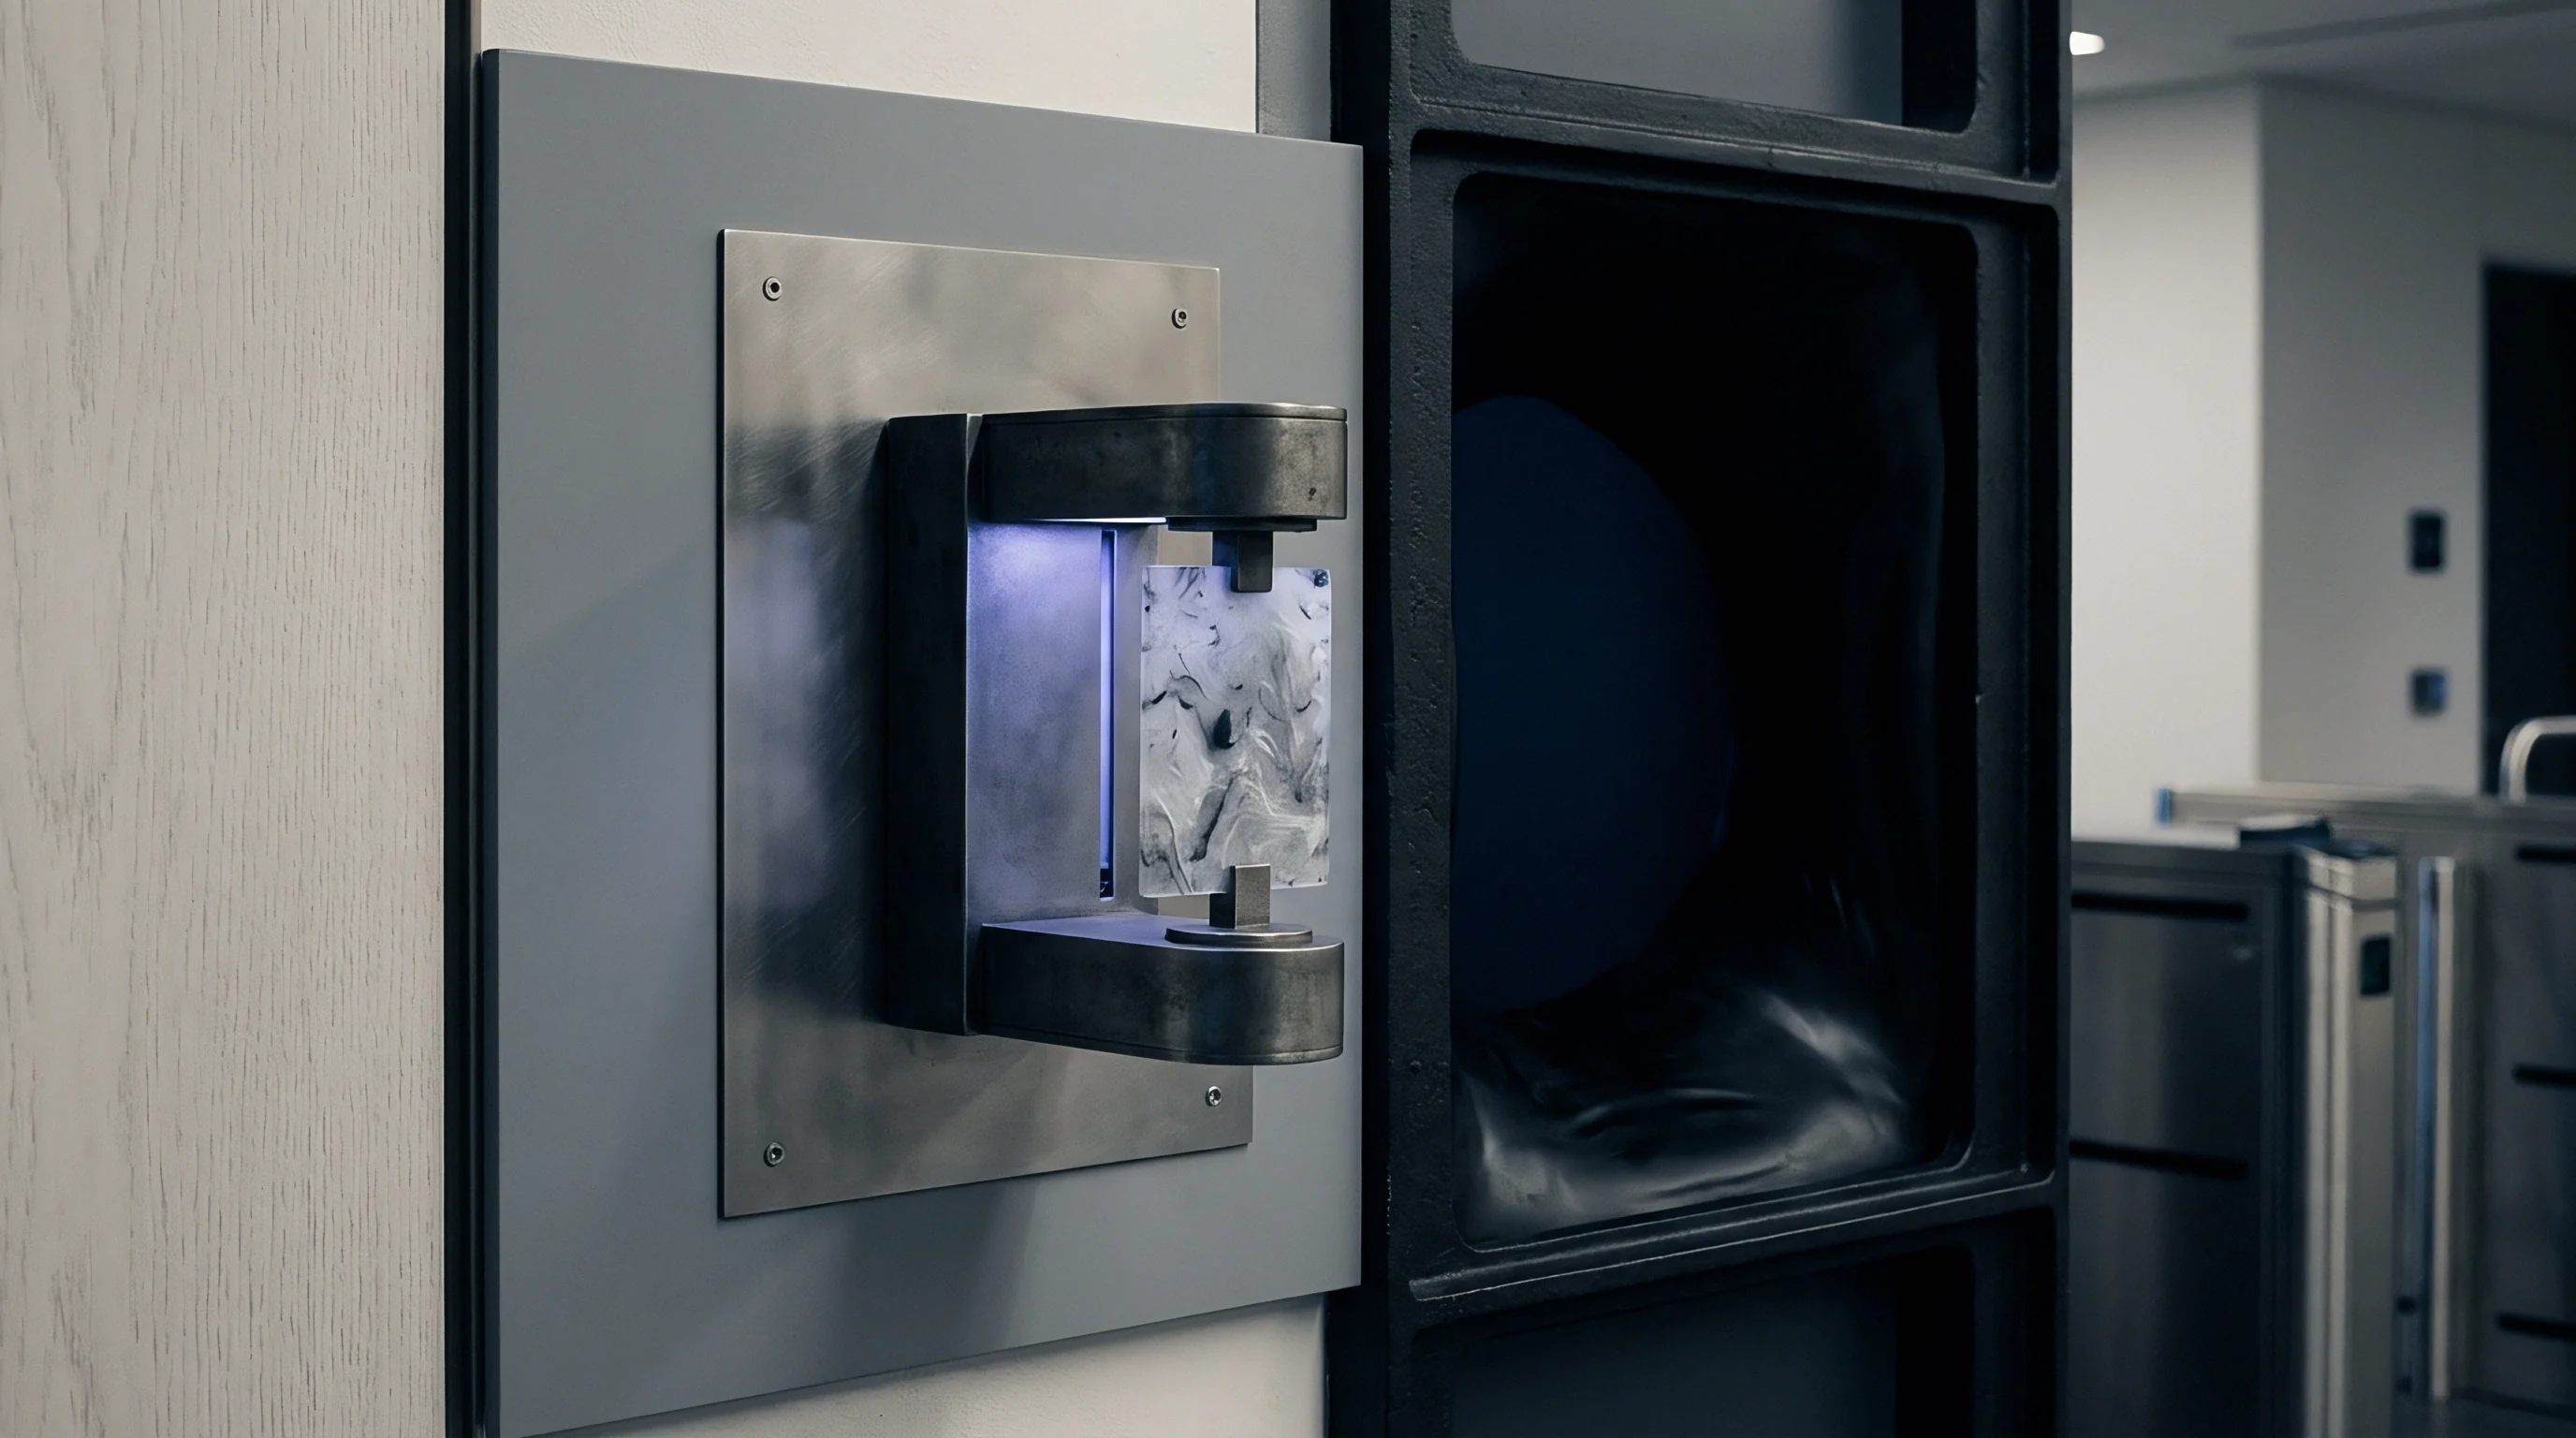
Quantifying damaged chains within an intact polymer matrix relies on mathematical inversion of dynamic modulus data. The continuous relaxation spectrum calculated from frequency sweep measurements mirrors the underlying molecular weight distribution, converting storage and loss moduli into relaxation time distributions that reveal the percentage of hydrolyzed fragments in commercial lots.

Does Low Frequency Oscillatory Shear Detect Microscopic Hydrolysis?
Small-amplitude testing at angular frequencies below 0.1 radians per second captures long relaxation modes. By applying Tikhonov regularization or maximum entropy methods to dynamic test data, rheologists reconstruct the continuous relaxation spectrum. While pristine resins exhibit a single peak tied to terminal entanglement relaxation, hydrolytic scission causes a secondary peak at much shorter relaxation times, corresponding to unentangled short-chain motion.
A 40-tonne lot of engineering-grade polybutylene terephthalate highlights how spectrum inversion quantifies degradation. Virgin PBT shows a dominant relaxation peak centered at 0.12 seconds at 250 °C. Processing under poor drying conditions adds a secondary peak at 0.003 seconds from short-chain fragments; integrating the area under this secondary peak relative to the total spectrum yields the precise mass fraction of degraded polymer.
The sequence outlines the analytical method for calculating hydrolyzed mass fractions from oscillatory frequency data:
- Perform dynamic frequency sweep testing from 500 rad/s down to 0.01 rad/s at target melt processing temperature inside a nitrogen-purged test cell.
- Extract storage modulus G’ and loss modulus G” across the frequency range, verifying data adherence to linear viscoelastic boundaries.
- Apply Tikhonov regularization software algorithms to invert modulus data into the continuous relaxation spectrum function H(tau).
- Deconstruct the continuous spectrum into primary entanglement peaks and low-tau secondary peaks using Gaussian peak fitting.
- Calculate the area ratio of the secondary low-tau peak against total spectral area to determine the mass percentage of hydrolyzed material.
Relaxation Spectrum Inversion and Worked Fraction Quantification
An incoming 50-tonne lot of bottle-grade PET resin illustrates this diagnostic approach. Baseline specifications for virgin PET set zero-shear viscosity at 450 Pa·s at 275 °C, weight-average molecular weight at 28,000 g/mol, and a terminal G’ slope of 1.95. Dynamic sweep analysis on the delivered material gave a zero-shear viscosity of 185 Pa·s and a terminal G’ slope of 1.32, pointing to moisture damage during handling.
Molecular weight scaling models show that average molecular weight fell to 22,100 g/mol, representing roughly 0.27 scissions per chain. Inverting the continuous relaxation spectrum reveals that 3.2 percent of the lot mass consists of short fragments below 5,000 g/mol ~ a population that causes severe drop-impact failure in molded preforms while remaining invisible to high-shear melt indexers.
| Sample Identification | Primary Relaxation Time (s) | Secondary Peak Mass Fraction (%) | Scission Density (Scissions/Chain) | Calculated Mw (g/mol) |
|---|---|---|---|---|
| Reference Virgin Lot | 0.145 | 0.0 | 0.00 | 28,000 |
| Processed Lot A (Clean) | 0.138 | 0.2 | 0.03 | 27,400 |
| Processed Lot B (Mild Wet) | 0.082 | 1.4 | 0.18 | 24,100 |
| Processed Lot C (Severe Wet) | 0.031 | 3.8 | 0.54 | 18,200 |
Whether oscillatory shear spectra can reliably distinguish linear hydrolytic scission from thermal-oxidative branching in polyamides remains an open question without industry consensus.

Clause
Procurement teams relying solely on standard melt flow rate specifications remain vulnerable to hidden degradation. Typical datasheets report high-shear melt index values that miss low levels of hydrolytic scission. Incorporating low-frequency rheological parameters directly into resin purchase agreements establishes enforceable quality thresholds that protect against sub-standard shipments.

Incoming Quality Control Specifications and Low Shear Criteria
Because technical datasheets omit low-frequency rheological parameters, moisture damage during storage often goes undetected until processing. Defining low-frequency acceptance criteria in purchase contracts sets a clear baseline. A complete raw material specification defines minimum zero-shear viscosity, terminal storage modulus slopes, and maximum allowable phase angles at low complex modulus values.
Unverified resin quality shows up on the plant floor. Running resin with a 2 percent hydrolyzed fraction increases scrap from flash, sink marks, and ejection breakage. On an automated line molding 500 structural automotive housings per hour, a 4 percent scrap rate adds 180 dollars per tonne in wasted energy, labor, and downtime.
Running a low-frequency rheological sweep on incoming material costs a fraction of the scrap generated in a single shift.

Landed Cost Impact and Contractual Rejection Thresholds
Processing contaminated lots leads to elevated scrap rates and premature field failures. Systematic receiving guidelines protect operations against silent resin substitutions or excessive regrind blends. Essential verification steps include:
- Sampling protocol execution requires taking sealed core samples from top, middle, and bottom sections of arriving bulk railcars or octabins.
- Moisture content verification confirms that incoming pellets meet deep-vacuum drying standards prior to rheological evaluation.
- Low-frequency sweep execution measures complex viscosity and storage modulus across angular frequencies from 100 rad/s down to 0.01 rad/s.
- Terminal slope calculation evaluates storage modulus fitting below 0.1 rad/s to confirm exponents remain above 1.80.
- Lot acceptance sign-off compares zero-shear viscosity against certificate of analysis baselines prior to siloing material.
| Material Grade | Test Standard | Contract Specification Boundary | Rejection Action Boundary | Financial Scrap Risk per Tonne |
|---|---|---|---|---|
| Automotive PA66 | ISO 6721-10 | Zero-Shear Viscosity ≥ 280 Pa·s | Viscosity < 220 Pa·s at 0.01 rad/s | $240 / Tonne Scrap |
| Medical PC | ISO 6721-10 | Phase Angle ≤ 52° at |G |=1 kPa | Phase Angle > 60° at |G |=1 kPa | $580 / Tonne Scrap |
| Optical PET | ISO 6721-10 | Terminal G’ Slope ≥ 1.85 | Terminal G’ Slope < 1.50 | $410 / Tonne Scrap |
| PBT Compound | ISO 6721-10 | Zero-Shear Viscosity ≥ 310 Pa·s | Viscosity < 250 Pa·s at 0.01 rad/s | $210 / Tonne Scrap |
Writing an ISO 6721-10 zero-shear viscosity minimum into supply contracts places financial liability for hydrolytic degradation on the compounder before resin ever reaches production hoppers.