Interfacial Instability Controls in Polymer Melt Processing
Interfacial instabilities resolve by exceeding critical die wall slip velocity through fluoropolymer additive coating or altering entrance exit shear stress.


Onset
Extruding polymers through narrow die orifices builds wall shear stress that often overcomes the melt stream’s cohesion. When linear low-density polyethylene (LLDPE) or high-density polyethylene (HDPE) runs through a steel die land at high rates, material near the wall stretches heavily as it exits the lip. This acceleration causes local tensile rupture, leaving periodic surface marks known commercially as sharkskin.
Pushing throughput higher pushes these local surface tears into broad flow oscillations, switching between high-speed slip and stick and creating deep volume defects throughout the profile.

Rheological Mechanics in High Shear Processing
Melt fracture sets in once wall shear stress at the die land exit hits a threshold between 0.10 MPa and 0.14 MPa for narrow molecular weight distribution polyolefins. Below this point, polymer chains move along the metal with stable velocity gradients. Above it, adhesion between the outer polymer layer and the die wall breaks down periodically.
High molecular weight chains disentangle quickly from the bulk fluid under tensile stress at the exit lip, creating small micro-tears that relax into high-frequency ridges across the surface.
Polymers with broad molecular weight distributions behave differently because their relaxation times spread over a wider range. Short chains function as internal plasticizers, softening the sharp elastic response that triggers micro-fracture. Long-chain branching, like that in low-density polyethylene (LDPE), adds strain hardening during extensional flow.
This hardening keeps the exiting skin layer stable against tensile failure, pushing the defect threshold to noticeably higher shear rates.
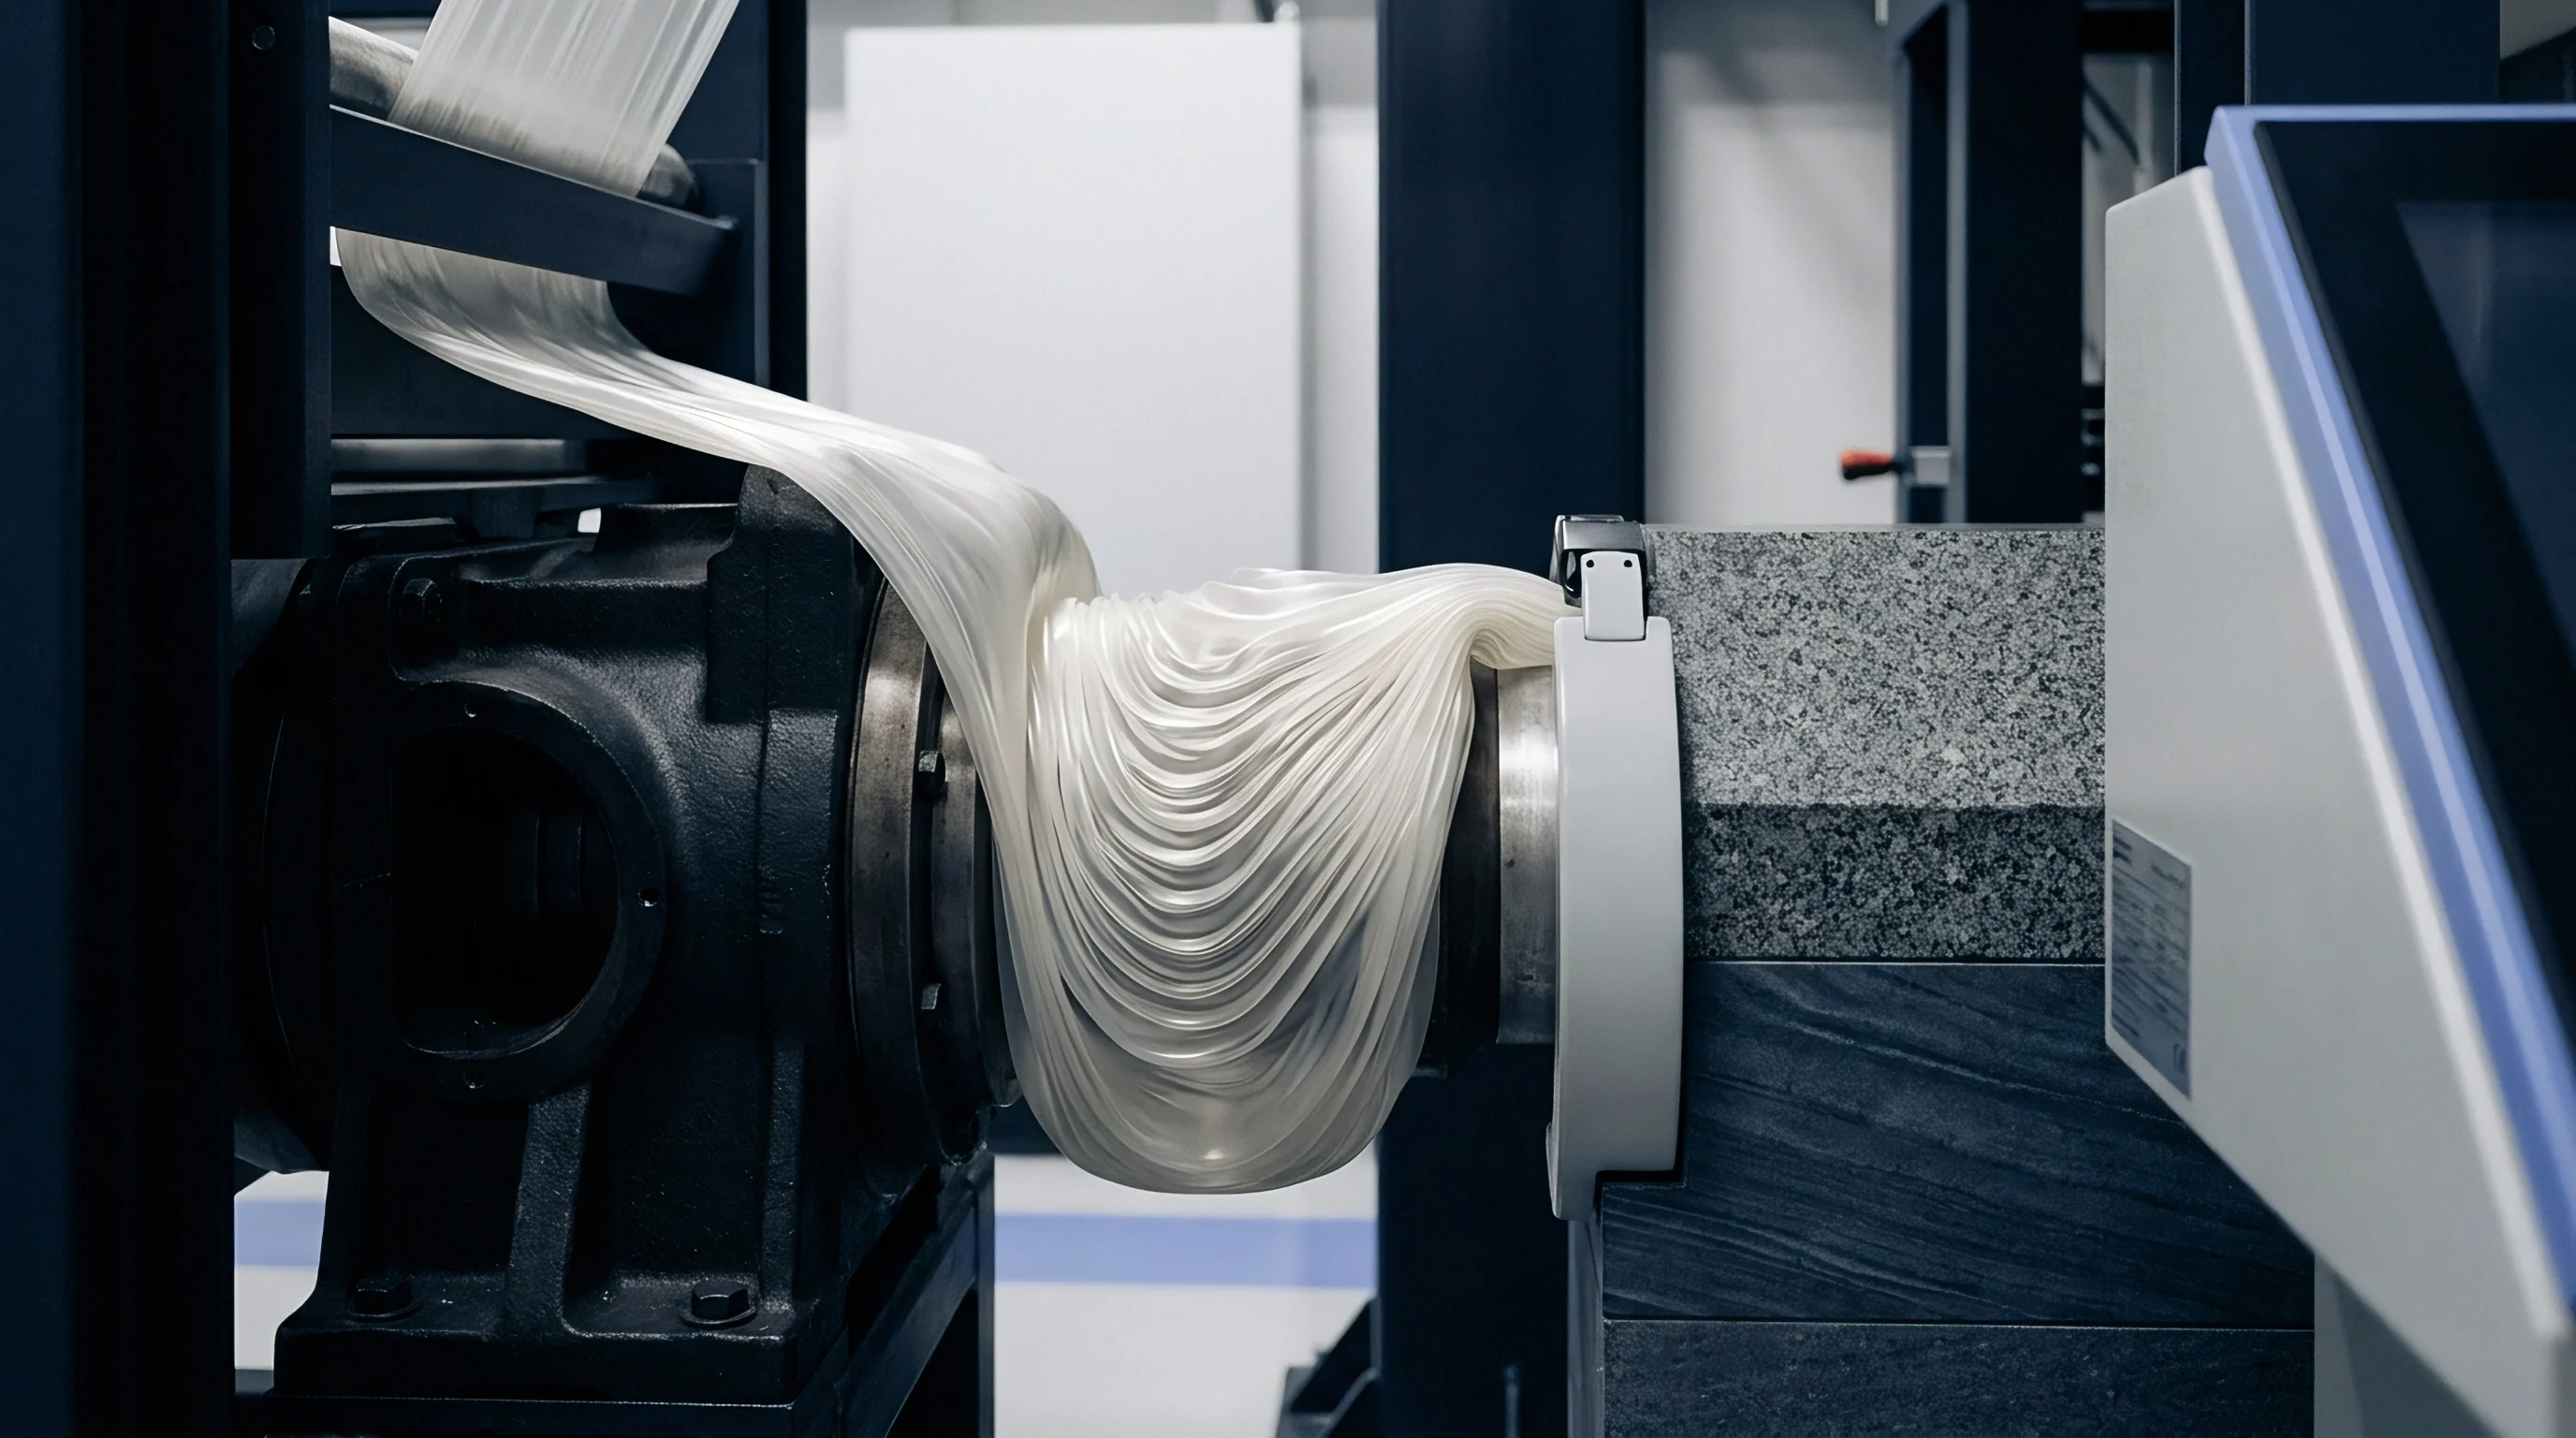
Interfacial failure occurs when tensile stresses at the die exit edge exceed the elastic strength of the polymer skin layer.
Distinguishing Surface Tearing from Bulk Flow Distortions
Sorting surface defects from structural flow issues determines how operators fix problems on the production line. Surface sharkskin shows up as fine, matte ridges running perpendicular to the flow without changing the extrudate’s overall cross section. Gross melt fracture, which takes hold when wall shear stress passes 0.40 MPa, disturbs the entire bulk profile to form heavy spiral, wave, or bamboo-like distortions.
The shift from surface tearing to gross flow distortion often moves through a stick-slip regime. In this range, measured entrance pressure cycles rhythmically between upper and lower limits at a steady volumetric extrusion rate. The polymer melt repeatedly sticks to the die land metal and breaks free, driving fast, periodic jumps in extrudate swell and line tension.
- Sharkskin surface fracture manifests as high-frequency periodic surface roughness originating exclusively at the die exit lip while bulk dimensions remain uniform.
- Stick slip oscillation produces alternating bands of smooth and rough extrudate accompanied by periodic pressure drop cycles inside the die land.
- Gross melt fracture generates severe volumetric distortions throughout the entire extrudate cross section driven by entrance flow instabilities upstream of the die gate.
- Interfacial wave instability occurs during coextrusion when shear stress differences across adjacent polymer melt layers exceed interfacial tension limits.
Extruding neat LLDPE without surface defects leaves a narrow operating window. Running below the critical shear stress threshold keeps the surface clear, but it caps line speed and limits output on capital equipment. Raising the melt temperature lowers viscosity and drops wall shear stress at a given flow rate, but it adds thermal load to the cooling tanks and slows down setting times downstream.
| Instability Mode | Critical Shear Stress (MPa) | Apparent Shear Rate Range (s⁻¹) | Extrudate Visual Profile |
|---|---|---|---|
| Smooth Linear Flow | 0.01 to 0.09 | 10 to 150 | High gloss, uniform cross section |
| Sharkskin Fracture | 0.10 to 0.14 | 150 to 800 | Matte surface finish, micro-ridges |
| Stick-Slip Transition | 0.15 to 0.35 | 800 to 2200 | Alternating smooth and rough bands |
| Gross Melt Fracture | 0.40 | 2200 | Severe volumetric wave and bamboo distortion |
Crossing the critical shear stress threshold without additive mitigation tears the surface right away, producing scrap runs that waste resin without usable output.


Discontinuity
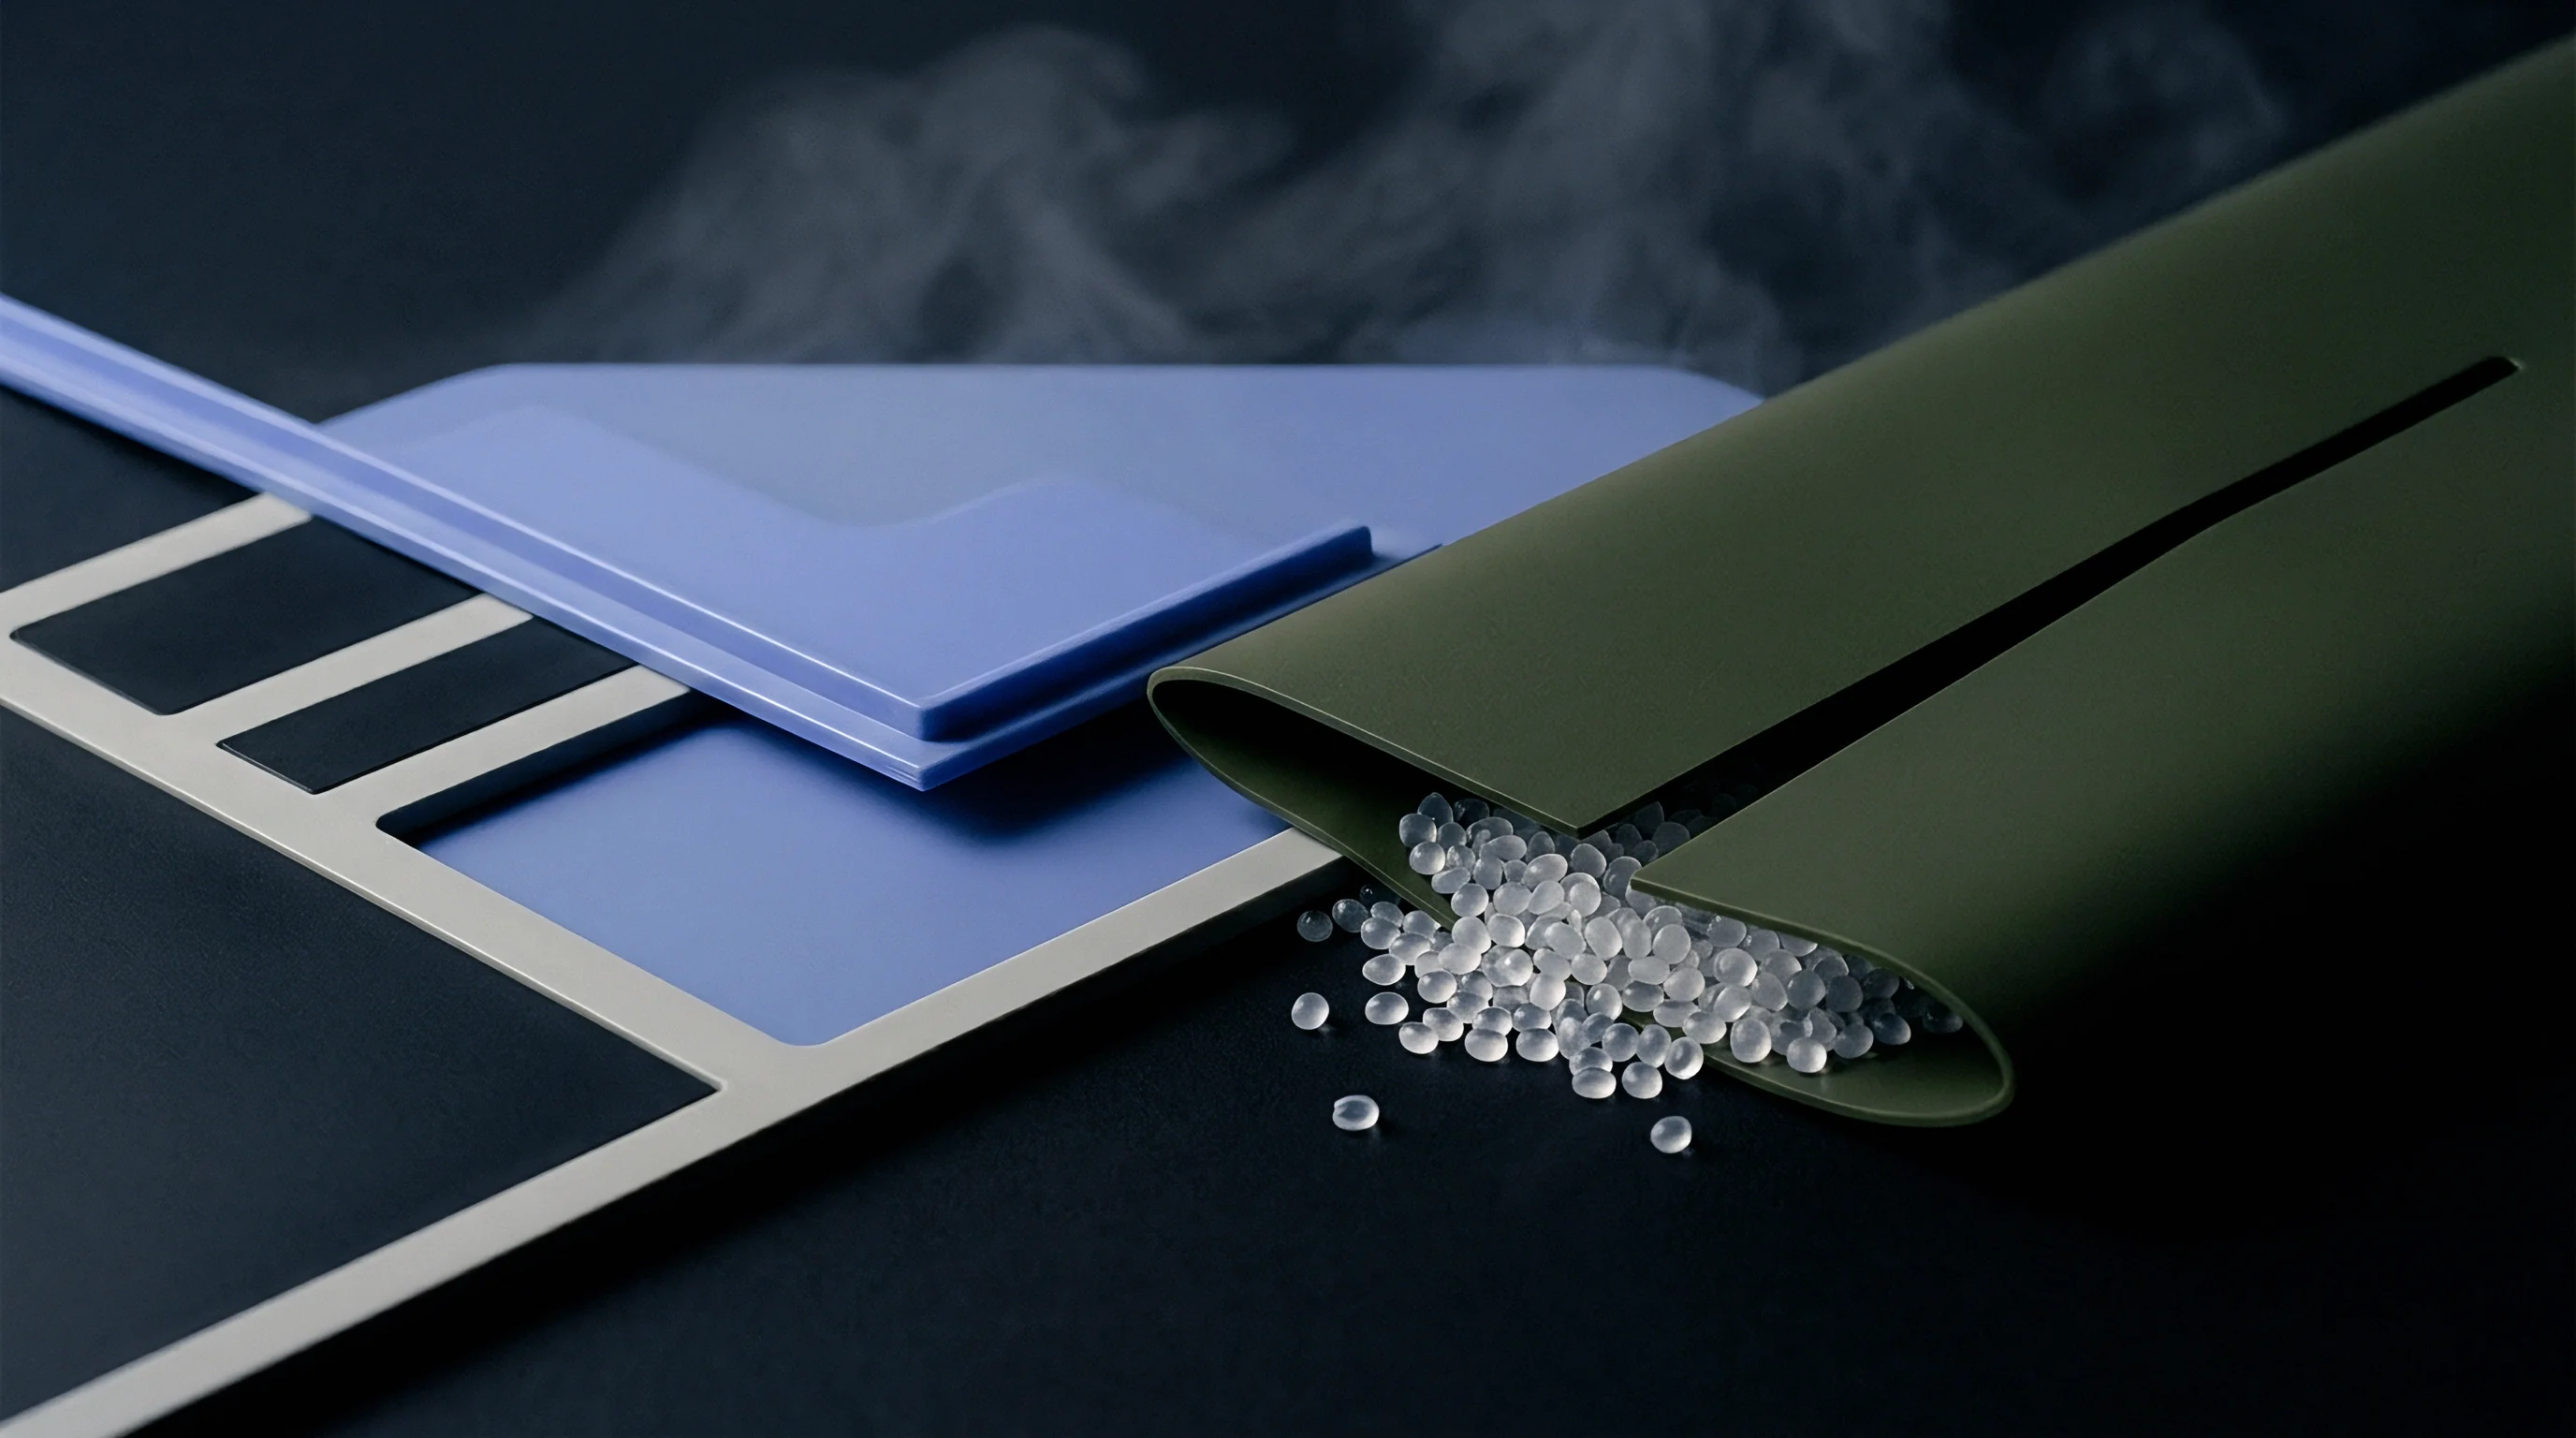
Coextruding polymers that are immiscible or poorly matched rheologically creates boundaries where velocity profiles and elastic properties shift abruptly. Where the two melt streams meet inside a feedblock or multi-manifold die, spatial gradients in shear and normal stresses excite fluid instabilities. Waves forming along these inner boundaries reduce optical clarity, distort barrier layers, and lead to delamination under bending in multilayer film and sheet.

Interfacial Shear Mismatch in Multilayer Flows
Velocity continuity forces both polymer streams to travel at the same speed where they touch inside the die. If their shear viscosities differ significantly at line temperature and shear rate, their velocity gradients diverge sharply moving away from the interface. A high viscosity ratio bends the velocity profile steeply across the thinner or less viscous layer, concentrating shear stress along the joint boundary.
When local shear stress across the melt interface passes a critical limit, small flow perturbations grow instead of dying out. These disturbances develop into zig-zag or wave instabilities that travel downstream. Matching the shear viscosity of adjacent layers at the shear rate existing inside the feedblock channel keeps these internal waves from growing.
Elasticity Ratios across Polymer Phase Boundaries
Matching viscosity alone will not prevent interfacial disturbances if elastic properties differ sharply between streams. The first normal stress difference (N1) measures the elastic energy polymer chains store during shear. A large N1 mismatch across the boundary produces a net force perpendicular to the flow, distorting layer thickness and structure.
Checking for elastic mismatch means measuring the storage modulus (G’) and loss modulus (G”) using dynamic mechanical analysis across actual processing frequencies. Resin pairs with large differences in elastic storage modulus show heavy wave growth at the interface, even if standard single-point melt flow index tests show identical viscosities. Choosing resins for coextrusion requires pairing both viscous and elastic relaxation behavior across all layers.
- Mount cleanly cut 25 millimeter disk samples of each resin layer into a parallel-plate rotational rheometer operating under nitrogen purge at processing temperature.
- Execute dynamic frequency sweeps from 0.1 to 100 radians per second at low strain amplitude to establish linear viscoelastic boundaries for storage and loss moduli.
- Calculate the loss factor tangent and first normal stress difference functions across the shear rate spectrum present within the feedblock manifold channels.
- Adjust target layer melt temperatures individually in multi-manifold tooling to align the elastic storage values of adjacent streams prior to structural merging.
Interfacial tension between immiscible polymers helps suppress short-wavelength waves along the boundary. Adding compatibilizers or maleic anhydride grafted resins lowers interfacial tension to improve adhesion, though it shifts local flow dynamics. Fine-tuning tie-layer thickness avoids local stress spikes while keeping the layer structure intact through orientation and cooling.
Micro-scale interfacial interdiffusion across polyolefin boundaries may not fully suppress wave instability when temperature gradients across adjacent die channels reach extreme spreads.


Die
Tooling geometry forms the main mechanical boundary shaping shear stress inside die channels. Standard steel tooling concentrates stress at transitions where channels narrow into final land sections. Adjusting channel taper angles, polishing land contact surfaces, and tuning land-to-gap ratios controls the level and distribution of wall shear stress without altering the resin formulation.

Land Length Ratios and Wall Finish Specifications
A longer die land gives polymer chains time to relax orientation stress built up in upstream entrance transitions. Running a land ratio (L/H, where L is land length and H is gap height) under 10:1 exposes exiting melt to unrelaxed normal stresses, dropping the shear rate threshold where sharkskin begins. Extending L/H to between 15:1 and 25:1 allows elastic stress to relax inside the land, stabilizing flow at the exit lip.
Roughness inside the land channel creates sites where microscopic slip transitions take root. Standard polished steel contains micro-cavities that anchor polymer molecules and raise local friction. Diamond-like carbon (DLC) coatings and precision nickel-fluoropolymer plating lower surface energy, reducing these anchor points and supporting controlled wall slip along the land.
Tooling specifications calling for die land polish below 0.05 microns Ra lower wall shear stress concentrations without altering bulk resin temperature settings.

Entrance Angles and Shear Stress Distribution
Abrupt 90-degree entrance angles into the die land create stationary recirculation vortices in corners upstream of the gate. Polymer caught in these dead spots sees prolonged heat and high shear, breaking down antioxidants and forming gel precursors. Tapering entrance transitions to angles between 30 and 45 degrees cuts down vortex formation, establishing a smooth velocity profile before the melt reaches the land.
| Die Geometry Configuration | Land Length Ratio (L/H) | Entrance Angle (degrees) | Shear Stress Reduction (%) | Defect Free Throughput Gain (%) |
|---|---|---|---|---|
| Standard Abrupt Entry | 10:1 | 90 | Baseline (0%) | Baseline (0%) |
| Streamlined Entry | 10:1 | 45 | 12% | 18% |
| Extended Land Length | 20:1 | 90 | 22% | 35% |
| Optimized Tapered Land | 25:1 | 30 | 38% | 62% |
Modifying internal die geometry requires balancing flow stability against pressure limits. Lengthening the die land increases total backpressure across the barrel, heating the melt through viscous shear. High backpressure draws more drive power and risks thermal damage to heat-sensitive resins, so entrance streamlining must be weighed against total system pressure drop.
Processing defects can stem from improper resin drying or incorrect masterbatch let-down rather than polishing marks inside the land section.

Modifier
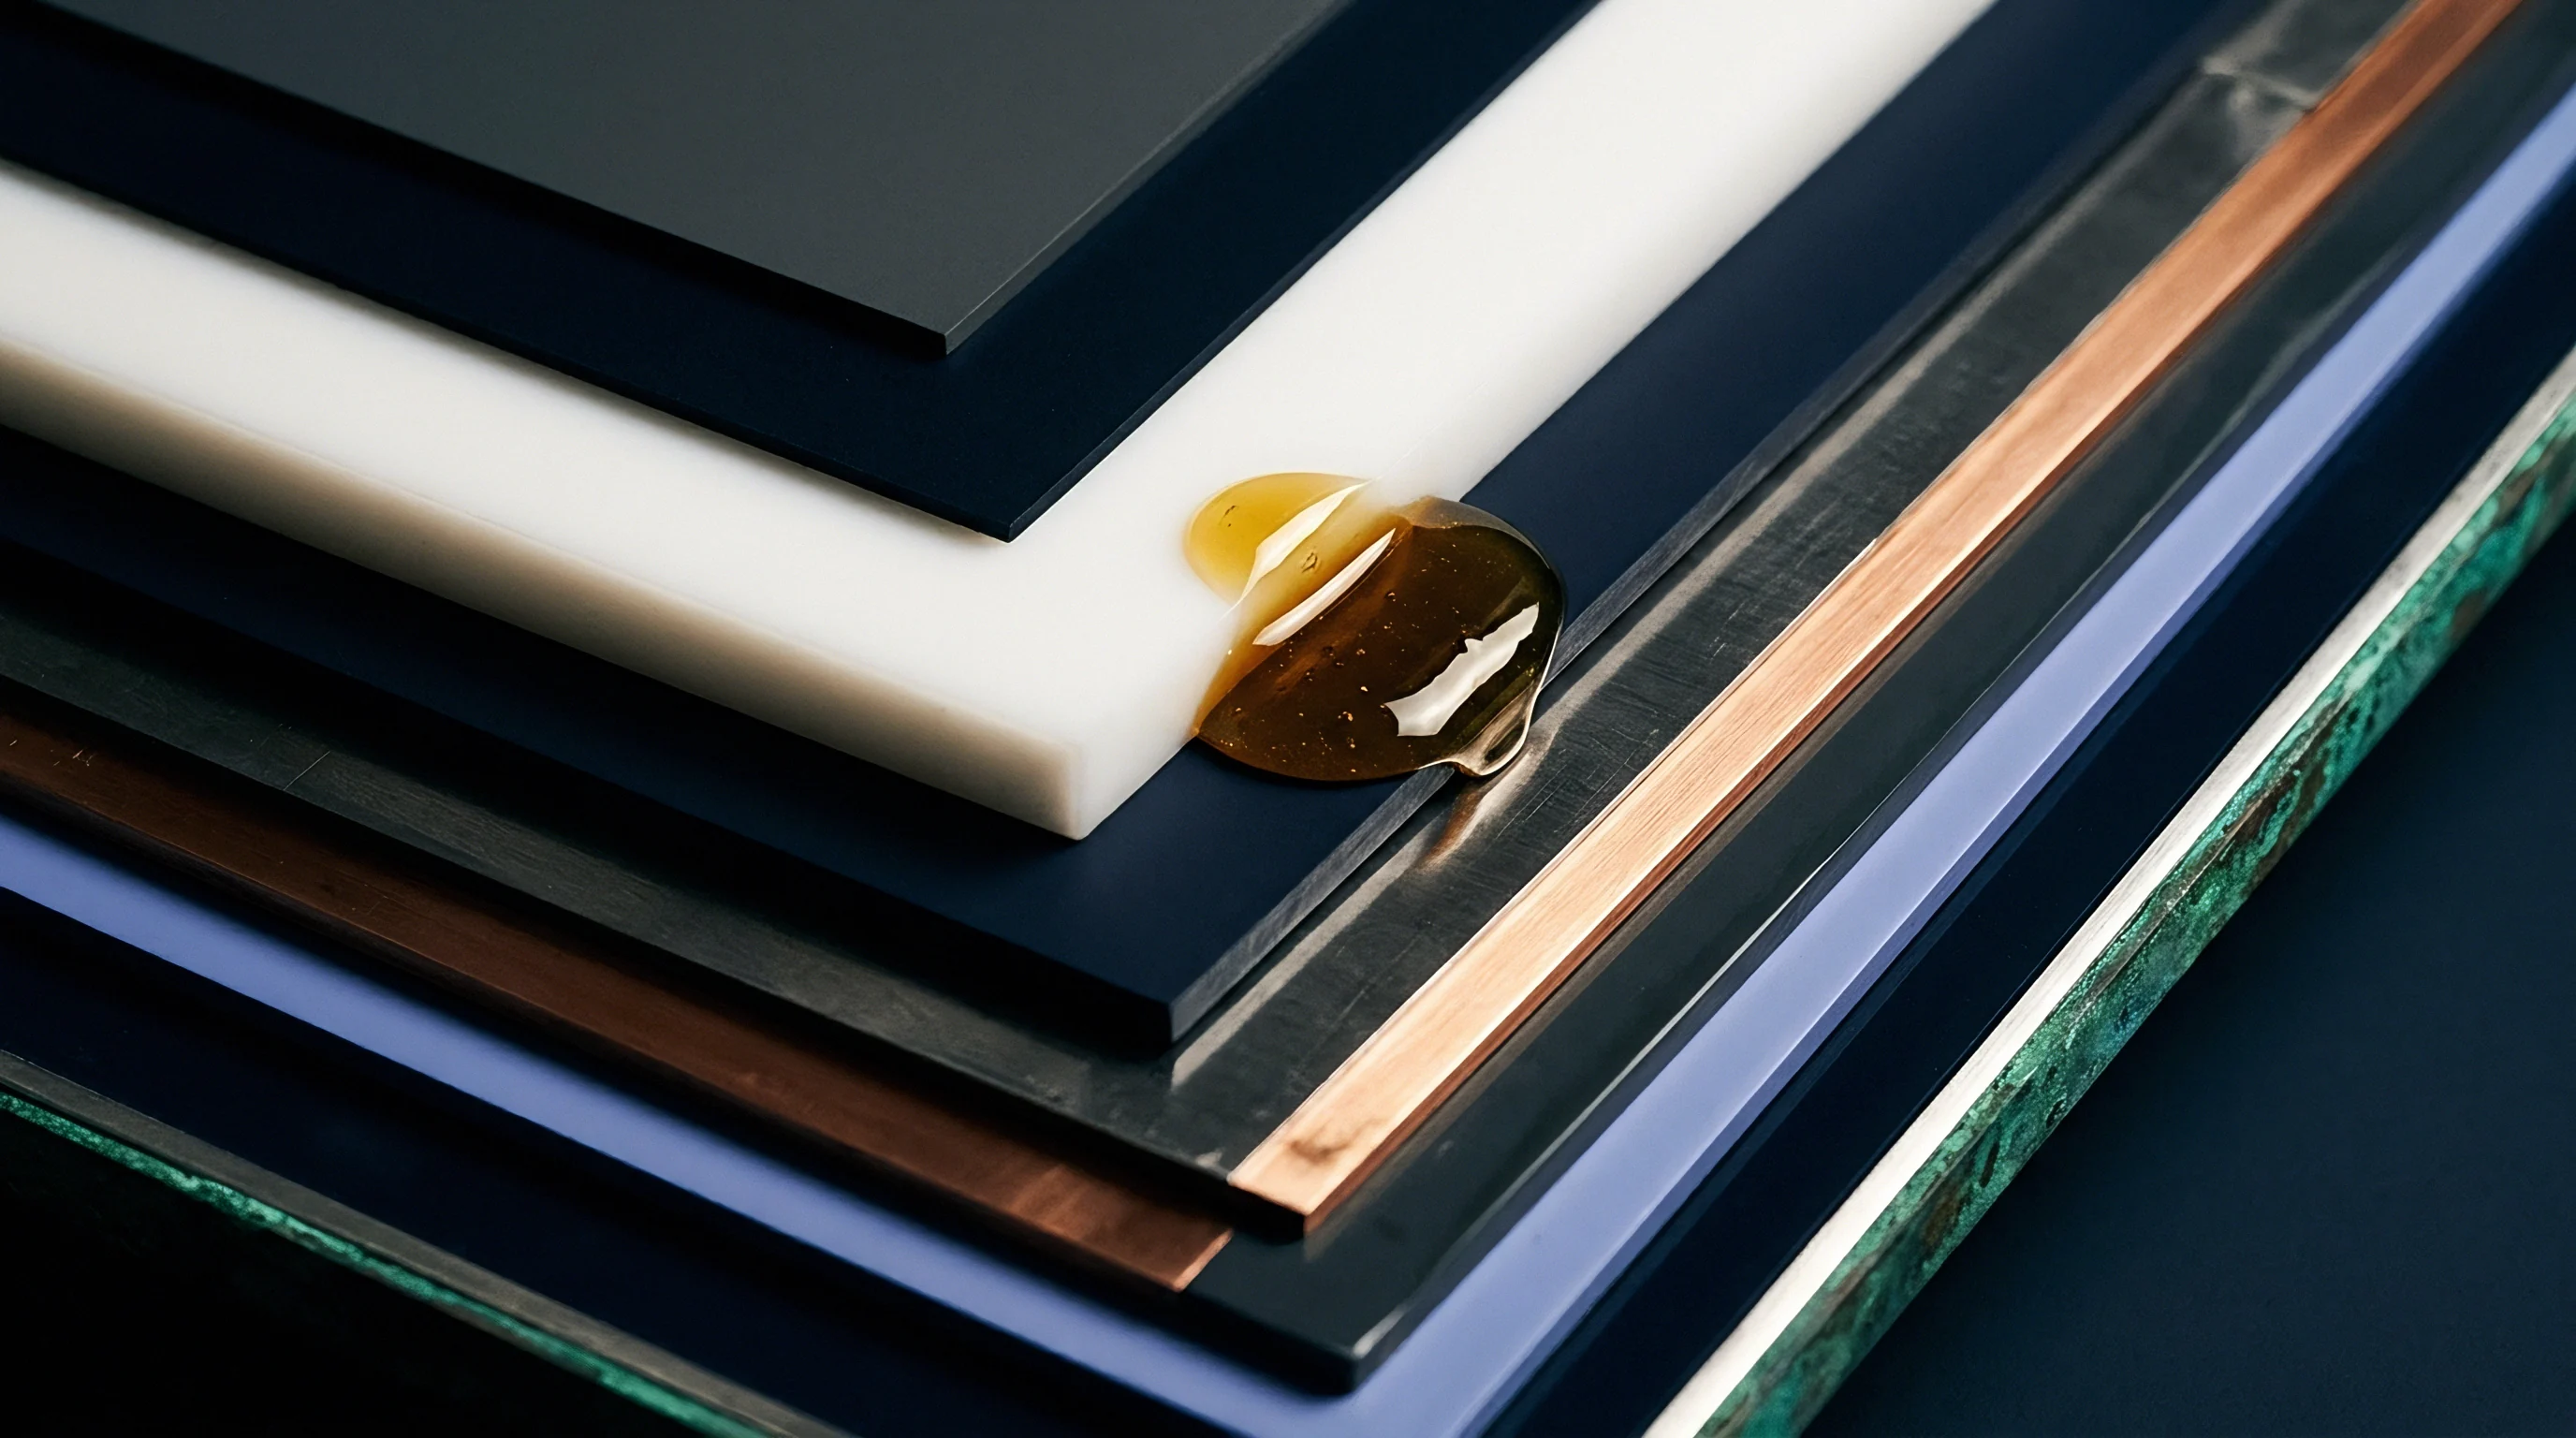
Fluoropolymer processing aids (PPAs) are the standard chemical solution for eliminating sharkskin in polyolefin extrusion. Dosed into resin at 200 ppm to 1000 ppm, these additives modify wall boundary behavior without altering bulk melt rheology. During processing, PPAs migrate to the steel land wall, coating it with a dynamic, low-energy layer that promotes steady wall slip.
Fluoropolymer Coating Mechanisms on Metal Walls
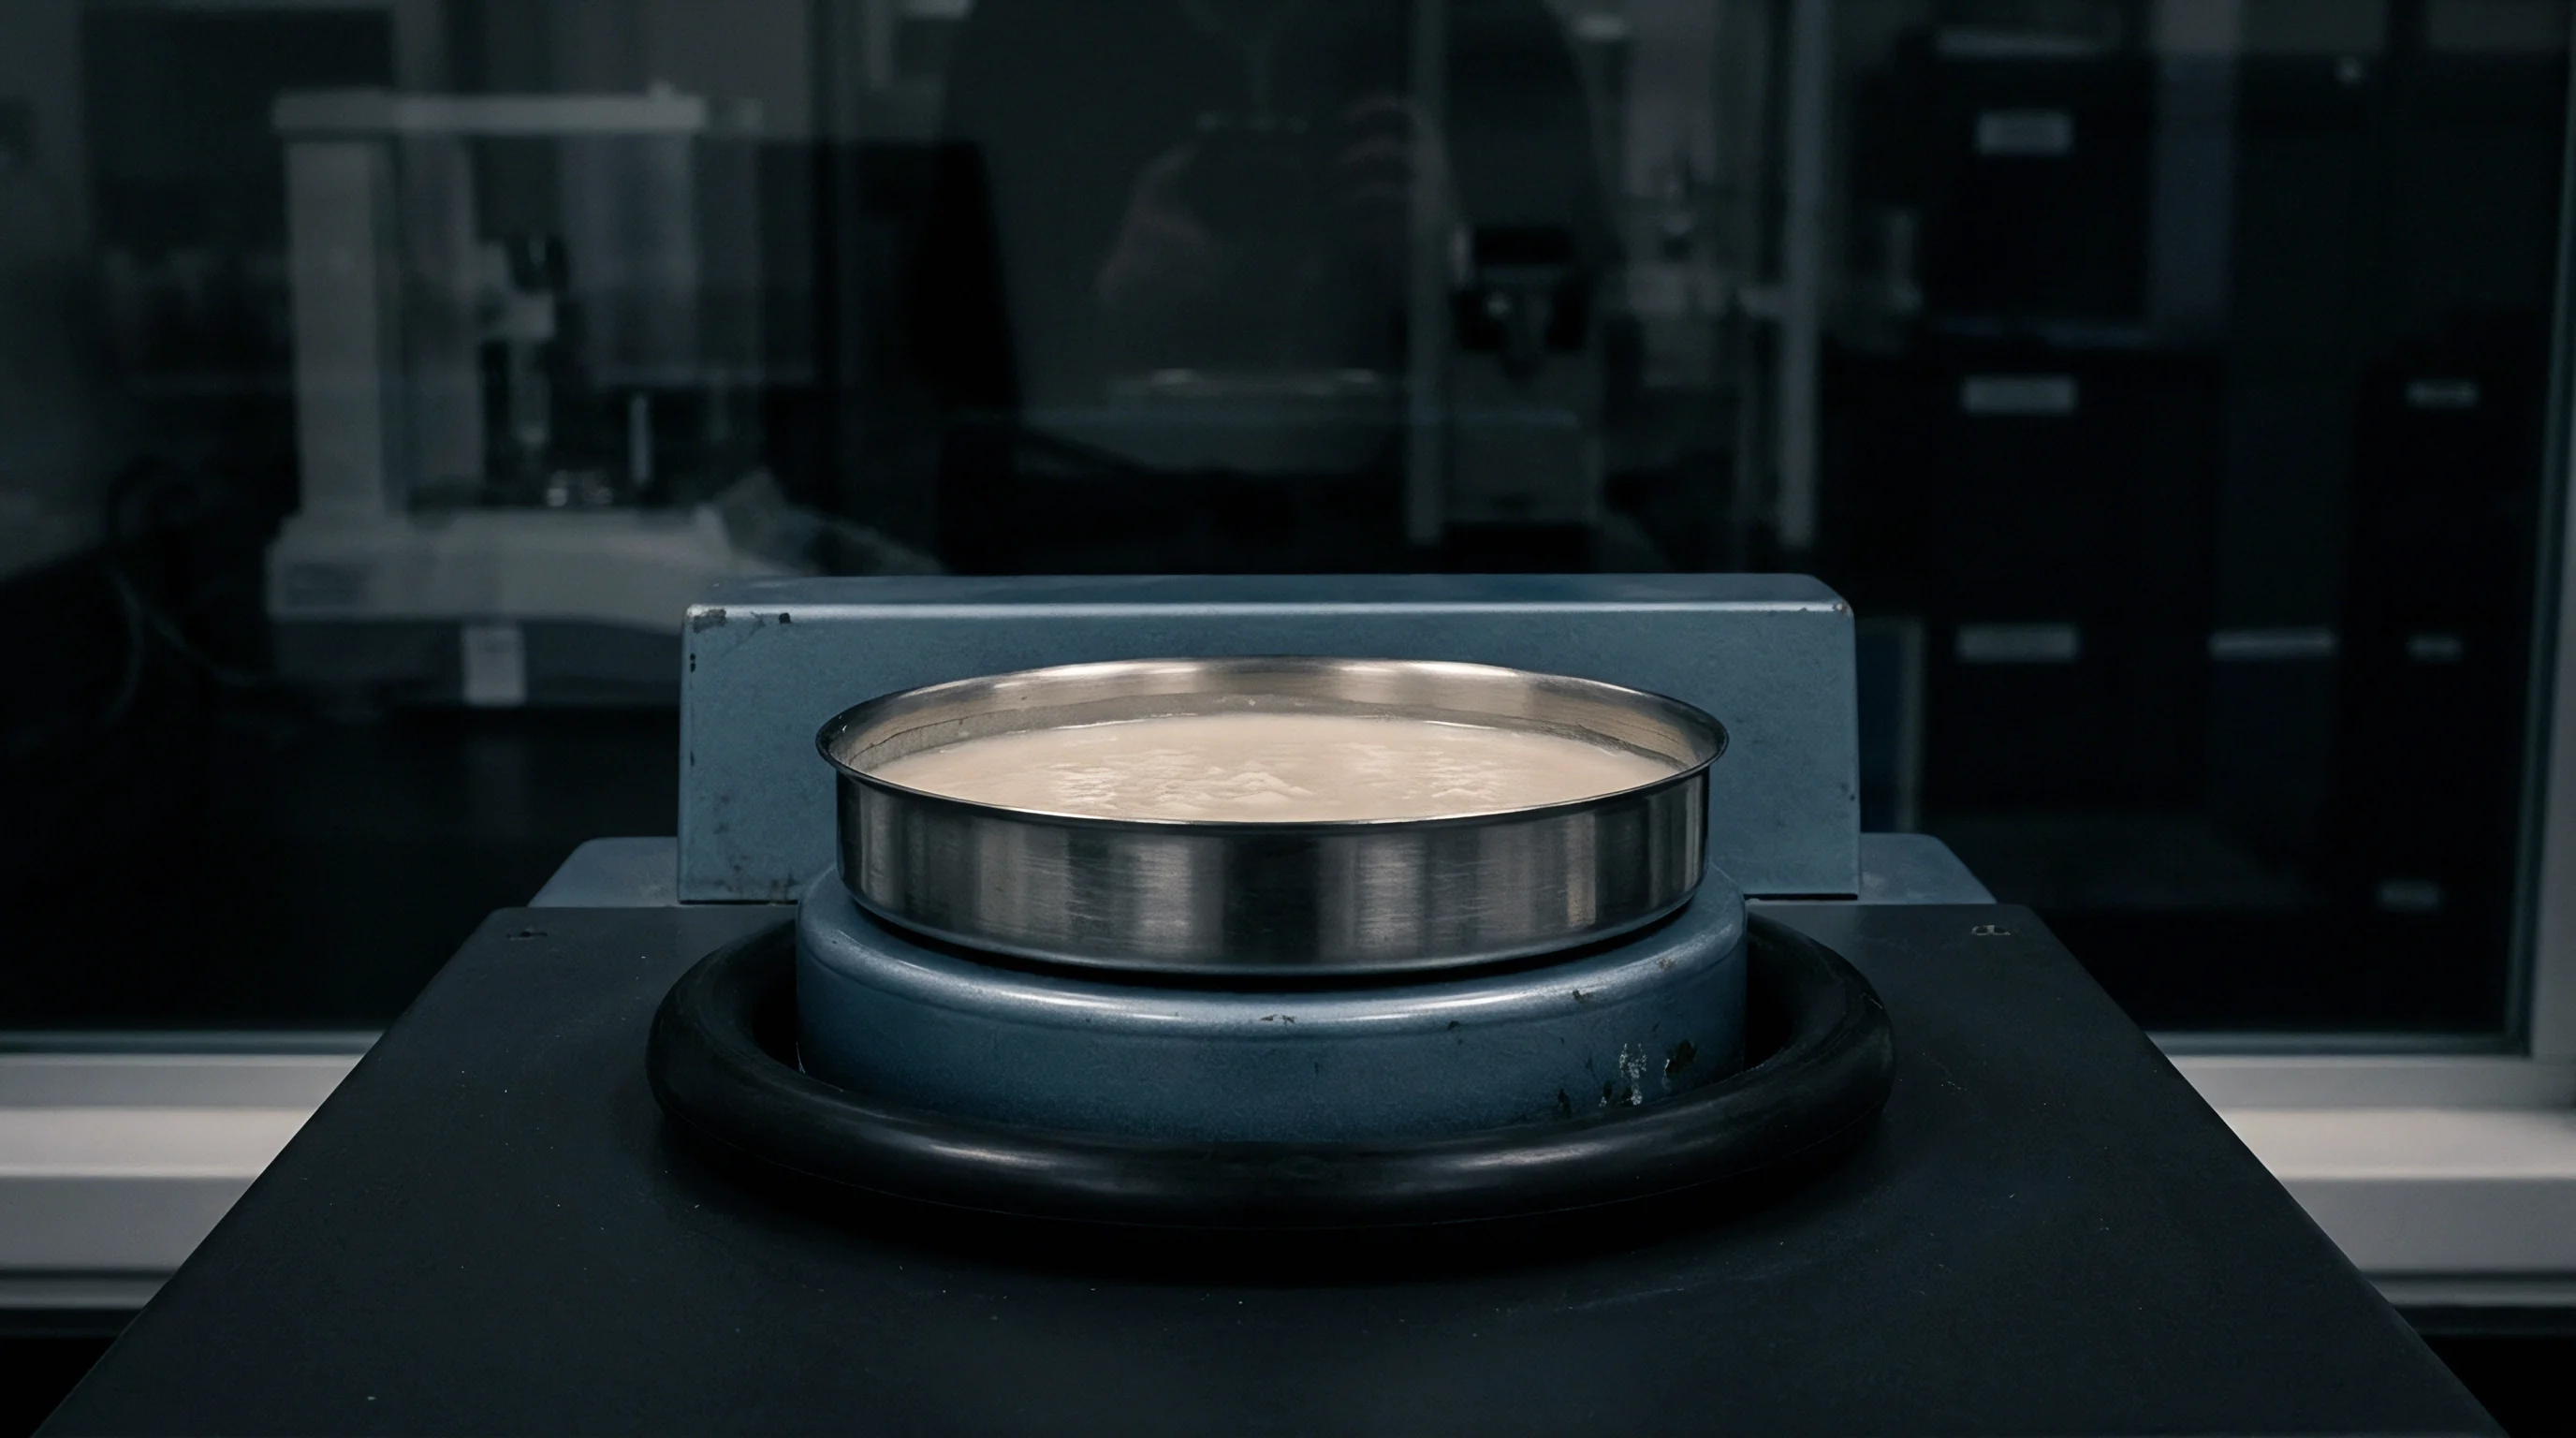
Fluoroelastomers used in PPA formulations rely on vinylidene fluoride and hexafluoropropylene copolymers. These polar polymers bind to the oxide layer on steel die walls while repelling non-polar polyolefin melts. Early in an extrusion run, fluoropolymer droplets dispersed in the matrix hit the metal die surface, stick, and smear into a continuous microscopic film.
Once established, the coating swaps the high-friction polymer-steel boundary for a slippery polymer-fluoropolymer interface. Polyolefin chains slip over this layer, pulling wall shear stress below the 0.10 MPa fracture limit at matching output rates. This lowers the effective shear rate at the wall while allowing volumetric flow to increase.
Fluoropolymer processing aids eliminate surface melt fracture by establishing a dynamic wall-slip layer that reduces exit shear stress without changing bulk melt viscosity.

Additive Let down and Dispersion Quality
Coating the die quickly and evenly depends on proper masterbatch let-down and uniform droplet dispersion in the host resin. Fluoropolymer masterbatches usually carry 2% to 5% active additive blended into a polyolefin carrier. If dispersion leaves fluoropolymer droplets larger than 5 microns, they fail to smear smoothly onto the metal, extending conditioning times from minutes to hours.
Droplets smaller than 0.5 microns also hurt performance because sub-micron particles stay trapped in the bulk flow and rarely hit the wall. A target dispersion between 1.0 and 3.0 microns yields the best deposition rate. Quality control on PPA masterbatches relies on optical dispersion checks on blown film samples or microscopic inspections of microtomed pellets before production let-down.
- Fluoroelastomer active chemistry forms the primary wall-coating layer that promotes continuous micro-slip along polished die land surfaces.
- Polyethylene glycol synergist acts as a low-melting secondary carrier that accelerates fluoropolymer droplet transport and smearing along metal interfaces.
- Inorganic anti-block additives such as silica or talc exert abrasive scouring actions that compete directly against fluoropolymer wall deposition dynamics.
- Hindered amine light stabilizers can interact chemically with fluoropolymer sites, requiring higher active PPA loading to maintain continuous slip performance.

Polyethylene Glycol Interactions with Chemical Additives
Formulators often combine fluoropolymers with low molecular weight polyethylene glycol (PEG) synergists at ratios between 1:1 and 1:3. PEG melts lower than fluoroelastomers, acting as a lubricant phase that carries fluoropolymer particles to the die wall faster. This addition cuts startup conditioning times, letting lines reach full defect-free speed within minutes.
Certain functional additives in host resins degrade PPA performance. High loadings of abrasive minerals like diatomaceous earth or calcium carbonate scour the fluoropolymer layer off die walls. Acid scavengers and amine-based light stabilizers can also react with fluoropolymer chains, disabling them.
Running heavily filled resins requires boosting active fluoropolymer levels up to 1500 ppm to counter constant coating wear.
| PPA Chemistry Class | Active Loading Range (ppm) | Operating Thermal Window (°C) | Conditioning Time (minutes) | Interaction Vulnerability |
|---|---|---|---|---|
| Standard Fluoroelastomer | 400 to 1000 | 180 to 230 | 45 to 90 | Moderate to high mineral abrasion |
| Fluoroelastomer + PEG Synergist | 200 to 600 | 170 to 220 | 15 to 30 | Thermal degradation > 240°C |
| Monomodal High-Density PPA | 300 to 800 | 200 to 280 | 30 to 60 | Low sensitivity to acid scavengers |
| Engineered Monomer Modified PPA | 150 to 500 | 160 to 250 | 10 to 20 | Extremely low; resistant to silica scour |
Commercial resin specifications with an ASTM D1238 melt flow tolerance of plus or minus ten percent allow rheological variations wide enough to disrupt PPA coating efficiency mid-run.


Surveillance
Incoming inspection has to catch rheological variation before virgin or recycled resin hits compounding hoppers or production lines. Standard single-point Melt Flow Rate (MFR) tests under ASTM D1238 or ISO 1133 (190°C / 2.16 kg) do not reflect high-shear processing, measuring flow only at low shear rates around 10 s⁻¹. Capillary rheometry, dynamic mechanical testing, and automated optical profiling supply the data needed to confirm stability.

Capillary Rheometry for Shear Stress Verification
Verifying interfacial stability limits requires multi-point capillary testing to ISO 11443 or ASTM D3835. Driving melt through precision tungsten carbide dies at shear rates from 10 to 5000 s⁻¹ generates true apparent shear stress curves, pinpointing the exact wall shear stress where surface tearing starts on test extrudates.
Capillary testing catches batch-to-batch variations in high molecular weight tails that single-point MFR values hide. Shipments with identical MFR numbers often show very different shear stress thresholds owing to small shifts in catalyst activity or reactor conditions. Requiring capillary stress profiles in quality dossiers avoids unexpected melt fracture during high-speed runs.
Quality dossiers reporting high-shear capillary viscosity data prevent silent production failures caused by unannounced resin synthesis changes.
Optical Profilometry and Surface Quality Metrics
Measuring surface micro-roughness on production extrudates swaps subjective operator checks for clear numerical standards. Non-contact optical profilometry uses white light interferometry or laser scanning confocal microscopy to map surface topography down to sub-micron scales. Tracking arithmetic mean roughness (Ra) and mean roughness depth (Rz) sets definitive pass-fail limits.
Smooth polyolefin extrudates maintain Ra values below 0.10 microns. Early micro-sharkskin pushes Ra into the 0.30 to 1.20 micron range well before defects are visible to the eye. Automated optical scanning flags surface degradation early, triggering PPA dosing pumps to rebuild boundary slip layers before generating off-spec scrap.
- Certificate of Analysis Validation requires verified capillary rheometry curves alongside standard ISO 1133 single-point melt index test results for every delivered resin lot.
- Active PPA Content Quantification mandates nuclear magnetic resonance (NMR) spectroscopy or fluorine X-ray fluorescence (XRF) testing on incoming compound pellets to confirm additive concentration.
- Extrudate Surface Roughness Thresholds specify maximum allowable Ra limits of 0.15 microns measured via optical laser profilometry during line startup qualification.
- Thermal Stability Index Verification requires differential scanning calorimetry (DSC) evaluation under ISO 11357 to establish oxidation induction time (OIT) minimum limits prior to compounding.
Maintaining stable processing relies on continuous capillary pressure tracking, as pressure drops occur before surface defects become visible on continuous runs.

Economics
Controlling interfacial instabilities directly affects plant profitability. Running below critical shear stress thresholds limits output, driving up fixed overhead per kilogram. On the flip side, pushing high line speeds without additive mitigation creates scrap that damages gross margins through wasted resin and extra processing costs.
Landed Resin Costs and Scrap Amortization
Calculating true additive costs requires weighing fluoropolymer let-down expenses against throughput gains and scrap reduction. Virgin LLDPE film resins trade at commodity baseline prices per metric tonne, while fluoropolymer PPA masterbatches cost far more per kilogram. Yet because let-down ratios are low ~ typically 1% to 2% masterbatch addition for a final 300 ppm active PPA target ~ the additive adds only a small fraction to total landed raw material costs.
Consider a high-speed LLDPE blown film line target set at 1000 kilograms per hour of packaging film. Without additives, sharkskin fracture caps defect-free output at 700 kilograms per hour. Pushing to 1000 kilograms per hour without PPA yields a 30% scrap rate, forcing off-spec film into regrind or heavy discounting.
Adding a fluoropolymer processing aid elevates defect-free output to 1000 kilograms per hour for a minor increase in unit cost.

Throughput Optimization against Additive Loading
Optimizing extrusion economics requires finding the balance point between additive let-down cost, energy per usable kilogram, and total yield. The table below outlines unit cost economics for an LLDPE film operation under different PPA mitigation strategies.
| Processing Strategy | Active PPA Loading (ppm) | Line Speed (kg/hr) | Scrap Rate (%) | Additive Cost per Tonne ($) | Net Landed Cost per Good Tonne ($) |
|---|---|---|---|---|---|
| Unmitigated Baseline | 0 | 700 | 1.5% | 0.00 | 1,421.00 |
| Unmitigated High Speed | 0 | 1,000 | 28.0% | 0.00 | 1,944.00 |
| Standard PPA Dose | 400 | 1,000 | 1.0% | 18.50 | 1,433.00 |
| Optimized PPA + PEG | 250 | 1,050 | 0.5% | 14.20 | 1,398.00 |
Running unmitigated resin at high speeds incurs severe financial losses from scrap generation. Investing in efficient fluoropolymer additives yields net savings by unlocking machine capacity and reducing regrind. Controlling interfacial wall shear stress balances part quality with landed manufacturing margins.
Balancing additive cost against higher line speed protects margins when let-down ratios are verified against true landed pellet prices.