In Line near Infrared Spectroscopic Feed Throat Calibration for Post Consumer Polyethylene
Feed throat near-infrared calibration resolves recycled polyethylene density and polypropylene contamination before pellets reach the extruder melting zone.


Window
The optical interface at the extruder throat endures severe mechanical abrasion from descending pellets alongside radiant heat conductively rising from the barrel throat cooling jacket. Solid post-consumer polyethylene pellets fall past the viewing port under gravity feed, creating an intermittent flow pattern across the sapphire measurement surface. Diffuse reflectance near-infrared sensors collect backscattered light through an optical grade sapphire disk brazed directly into a stainless steel flush mount adapter.
Pellet velocity varies constantly. Standard gravimetric feed configurations generate velocity differentials from 0.2 to 1.8 meters per second directly across the probe face, altering the optical integration geometry during rapid continuous scans.
Sapphire survives mechanical impact. Mineral fillers such as calcium carbonate and residual post-consumer silica grit scour softer quartz windows within seventy operating hours, pitting the substrate and inducing false baseline drift across the 1100 to 2200 nanometer spectral region. Sapphire maintains a Mohs hardness of 9, resisting particle abrasion under continuous extruder loading.
Optical path geometry requires a flush mechanical fit along the feed throat interior wall. Any probe recession exceeding 0.5 millimeters forms a stagnant cavity where fine polymer dust settles, obscuring the incident beam and extinguishing the diffuse reflectance signal.
Diffuse reflectance spectra collected at 1680 nanometers show a 12 percent drop in signal intensity when feed throat temperature rises from 40 to 85 degrees Celsius.

Optical Interface Geometry and Sensor Mounts
Mounting an immersion probe directly against the gravity drop creates a stagnant boundary layer of polymer fines touching the sapphire glass. The sensor collar positions the optical face at a 45-degree angle relative to pellet descent, permitting the falling mass to sweep the sapphire face clear during operation. Extruder throat designs incorporate an air purge ring surrounding the probe mount.
Low-pressure dry nitrogen or filtered plant air delivered at 0.5 bar prevents airborne fines from adhering to the optical perimeter. The purge cycle clears fines.
Fiber optic bundles transmit the source beam from an external halogen lamp to the feed throat housing, returning the scattered radiation to an indium gallium arsenide diode array detector. Decoupling the spectrometer from the physical extruder prevents low-frequency mechanical vibrations from 60 Hz drive motors from distorting the optical path. Fiber lines encased in flexible stainless steel conduit tolerate ambient temperatures up to 120 degrees Celsius while isolating the interferometer from mechanical shock.

Thermal Equilibration at the Extruder Throat
Cooling jackets maintained at fifty degrees Celsius stabilize the stainless steel collar against the heat conducted upward from the feed section zone. Post-consumer polyethylene softens between 85 and 110 degrees Celsius depending on the relative presence of high density and low density polymer fractions. Unchecked thermal conduction melts fines onto the optical window, forming an immovable polymeric film that invalidates chemometric calibration models.
- Stagnant dust accumulation blinds the sapphire optic through electrostatic adherence of high density polyethylene fines within thirty minutes of unassisted operation.
- Excessive radiant heat conduction shifts the detector diode response profile, introducing false baseline elevations across the near-infrared spectrum.
- Mechanical probe protrusion shears descending pellets against the screw flights, creating local burn marks and gouging the optical housing.
Maintaining stable thermal equilibrium at the throat demands dedicated liquid recirculation loops isolated from downstream barrel cooling circuits. Extruder operators monitor thermocouple taps positioned three millimeters behind the sapphire mount to verify that metallic housing temperatures remain below sixty degrees Celsius during high-output production. Optical interfaces kept clean by continuous air curtains yield steady analytical signals regardless of hopper volume fluctuations.


Band
Hydrocarbon absorption features in the short-wave and long-wave near-infrared spectrum arise from transitions of molecular vibrations within polymer backbones. In-line diffuse reflectance systems capture overtones and combination bands of fundamental carbon-hydrogen stretching modes occurring between 1100 and 2400 nanometers. Post-consumer polyethylene exhibits distinct absorption peaks determined by its crystalline morphology, short-chain branching frequency, and incidental cross-contamination from polypropylene packaging fractions.
Methylene groups dominate the spectra.
Primary overtone responses for post-consumer polyethylene concentrate in two distinct optical regions. The second overtone of the carbon-hydrogen stretching vibration manifests between 1150 and 1250 nanometers, providing high photonic penetration depth through bulk pellet streams. The first overtone region spans 1650 to 1800 nanometers, yielding elevated absorption coefficients that resolve subtle variations in methyl branching.
Linear low density polyethylene grades exhibit heightened methyl absorption at 1698 nanometers relative to high density polyethylene grades due to ethyl, butyl, and hexyl side branches along the backbone.

Which Wavelengths Isolate Polypropylene Contamination in Polyethylene?
Spectral regions between 1150 and 1250 nanometers resolve the second overtone of carbon-hydrogen single bonds, separating methyl pendants from backbone methylene groups. Polypropylene cross-contamination represents the primary degradation factor for post-consumer polyethylene melt strength and notched izod impact resistance. The recurring tertiary carbon-hydrogen bond and pendant methyl group of isotactic polypropylene produce distinct vibrational signatures absent in pure ethylene homopolymers.
Methyl groups absorb at distinct intervals.
In-line calibration models isolate the second overtone methyl stretch of polypropylene at 1195 nanometers alongside its first overtone combination bands at 1712 and 1730 nanometers. Pure polyethylene displays minimal absorption at 1712 nanometers, where methylene stretching dominates at 1725 and 1762 nanometers. The ratio of absorbance values at 1712 nanometers to 1762 nanometers establishes an empirical foundation for measuring polypropylene fractions down to 0.3 percent by weight in incoming flake and pellet blends.
| Wavelength (nm) | Chemical Structure Assignment | Target Polymer Type | Vibrational Transition Mode |
|---|---|---|---|
| 1195 | CH3 pendant group | Polypropylene | Second C-H stretching overtone |
| 1215 | CH2 backbone group | Polyethylene | Second C-H stretching overtone |
| 1395 | CH2 combination band | Polyethylene | C-H combination bending and stretching |
| 1698 | CH3 branch group | Linear Low Density Polyethylene | First C-H stretching overtone |
| 1712 | CH3 symmetric stretch | Polypropylene | First C-H stretching overtone |
| 1725 | CH2 asymmetric stretch | High Density Polyethylene | First C-H stretching overtone |
| 1762 | CH2 symmetric stretch | Polyethylene | First C-H stretching overtone |
| 2280 | CH2 combination band | High Density Polyethylene | C-H combination stretching and deformation |
| 2310 | CH3 combination band | Polypropylene | C-H combination stretching and rocking |

Density Resolution across Post Consumer Polyethylene Grades
Differences in short-chain branching govern the solid-state packing and relative amorphous fraction of post-consumer resins. High density polyethylene exhibits crystalline fractions from 65 to 80 percent, producing tight polymer packing that sharpens the absorption features centered at 1725 and 1762 nanometers. Low density polyethylene derived from high-pressure autoclave or tubular reactors possesses broad long-chain and short-chain branching distributions, causing peak broadening and minor band shifts toward 1735 nanometers.
Quantitative calibration models differentiate blow-molding grade high density polyethylene, defined by a density between 0.952 and 0.958 grams per cubic centimeter under ISO 1183, from fractional melt film grades possessing densities between 0.918 and 0.925 grams per cubic centimeter. The spectral band area between 1700 and 1780 nanometers changes proportionally with the degree of crystallinity. Diffuse reflectance sensors capture this morphology shift in real time, alerting compounding engineers to unannounced inclusions of film-grade linear low density material within rigid blow-molding regrind streams.
Compounding vendors frequently claim that minor polypropylene fractions melt out harmlessly during extrusion cycles without degrading end-use impact performance.


Model
Partial least squares regressions correlate discrete absorption intensities with physical resin characteristics gathered through primary laboratory analytics. Calibration matrices relate spectral vectors to melt mass-flow rates determined by ASTM D1238 at 190 degrees Celsius under 2.16 kilogram and 5.0 kilogram loads, density measured via ISO 1183 displacement columns, and polypropylene cross-contamination percentages verified by carbon-13 nuclear magnetic resonance. Baseline offsets ruin raw spectra.
Developing a predictive chemometric engine demands extensive sample populations spanning multiple post-consumer collection campaigns. Variations in regional feedstock, washing efficiencies, and seasonal sorting purities introduce operational variance into the training matrix. Calibration algorithms built upon narrow virgin resin controls collapse when exposed to post-consumer lots containing degradation byproducts, residual slip agents, and cross-fractional polymers.
Finer mathematical filtering sharpens peak separation while amplifying detector background disturbances.

Multivariate Preprocessing and Scatter Correction
Standard normal variate transformations and first-derivative filtering eliminate broad baseline offsets caused by nonuniform particle dimensions. Post-consumer regrind contains an uncontrolled distribution of pellet shapes, die-face cut tears, and shredded flake geometries. These physical irregularities alter the optical path length from sample to sample, causing vertical shifts across the entire spectral envelope.
Multiplicative scatter correction normalizes each scan against an average reference spectrum, decoupling chemical absorption from physical light scattering.
Second-derivative mathematical treatments applying the Savitzky-Golay algorithm with a nine-point smoothing window resolve heavily overlapped bands within the first overtone region. First-order derivatives remove constant baseline offsets, while second-order derivatives remove sloped baseline drifts induced by fluctuating sample presentation temperatures. Unchecked drift invalidates calibration.
- Collection of representative lot specimens spans twenty distinct production runs to capture the full breadth of post-consumer molecular weight variance.
- Primary reference laboratory characterization establishes differential scanning calorimetry melting points, melt mass-flow rates, and carbon-13 nuclear magnetic resonance branching profiles.
- Spectral preprocessing mathematical filtering applies standard normal variate algorithms and Savitzky-Golay first derivatives to eliminate baseline scattering shifts.
- Partial least squares regression computation cross-validates latent variables against root mean square error of prediction to prevent model overfitting.

Reference Analytical Testing for Secondary Fractions
High-temperature gel permeation chromatography and differential scanning calorimetry yield the empirical baseline values demanded by chemometric software. Laboratory technicians characterize ninety discrete calibration samples across three melt index ranges: fractional blow-molding homopolymers (0.25 to 0.45 grams per 10 minutes at 190 C / 2.16 kg), injection-molding copolymers (4.0 to 8.0 grams per 10 minutes at 190 C / 2.16 kg), and tubular film resins (0.7 to 1.2 grams per 10 minutes at 190 C / 2.16 kg). Primary analytical data populate the reference property vector Y, which is regressed against the processed spectral matrix X.
| Resin Parameter | Reference Test Method | Spectral Range (nm) | Latent Variables | Correlation Coefficient (R2) | Root Mean Square Error |
|---|---|---|---|---|---|
| Polypropylene Content | DSC (ISO 11357-3) | 1170 to 1240, 1680 to 1750 | 4 | 0.984 | 0.32 wt% |
| Melt Mass-Flow Rate | ASTM D1238 (190 C / 2.16 kg) | 1650 to 1820, 2200 to 2350 | 6 | 0.941 | 0.08 g/10 min |
| Base Resin Density | ISO 1183-1 Method A | 1690 to 1780 | 5 | 0.962 | 0.0018 g/cm3 |
| Inorganic Ash Fraction | TGA (ASTM D5630) | 1350 to 1480, 2100 to 2250 | 3 | 0.915 | 0.15 wt% |
| Moisture Content | Karl Fischer (ASTM D6869) | 1420 to 1460, 1920 to 1960 | 2 | 0.978 | 45 ppm |
| Calibration statistics derived from ninety post-consumer polyethylene validation lots cross-referenced against primary thermal, rheological, and Karl Fischer laboratory measurements. | |||||
Latent variable selection balances predictive accuracy against model overfitting. Incorporating more than seven latent variables into the partial least squares regression incorporates detector background noise into the prediction vectors, degrading model robustness when ambient compounding hall temperatures fluctuate. Five latent variables capture 96.2 percent of the density variance, holding root mean square error of prediction within 0.0018 grams per cubic centimeter.
Whether mathematical transfer algorithms can successfully adapt a feed throat calibration across different twin-screw extruder barrel diameters remains an open engineering challenge for compounders.


Noise
Optical attenuation within the extruder hopper stems primarily from particle morphology variations and opaque pigment additions. Industrial post-consumer polyethylene streams contain variable concentrations of carbon black, titanium dioxide, masterbatch carrier resins, and insoluble organic colorants. Black masterbatch blinds the sensor.
Photons projected into a stream containing fine carbon black particles undergo total absorption rather than diffuse backscattering, collapsing the signal-to-noise ratio of diode array spectrometers below readable operating limits.
Scattering dynamics shift as pellet dimensions fluctuate across production lots. Pellets processed through underwater pelletizers exhibit spherical forms with smooth surfaces, whereas strand-cut pellets present cylindrical profiles with fractured, irregular end cuts. The ratio of specular reflectance off smooth pellet facets to diffuse reflectance penetrating the pellet bulk varies dynamically, introducing non-chemical amplitude shifts across all detector channels.
Purchasing specifications citing ASTM D7611 penalize resin deliveries containing more than two percent foreign polyolefin fractions through automatic price de-escalations.
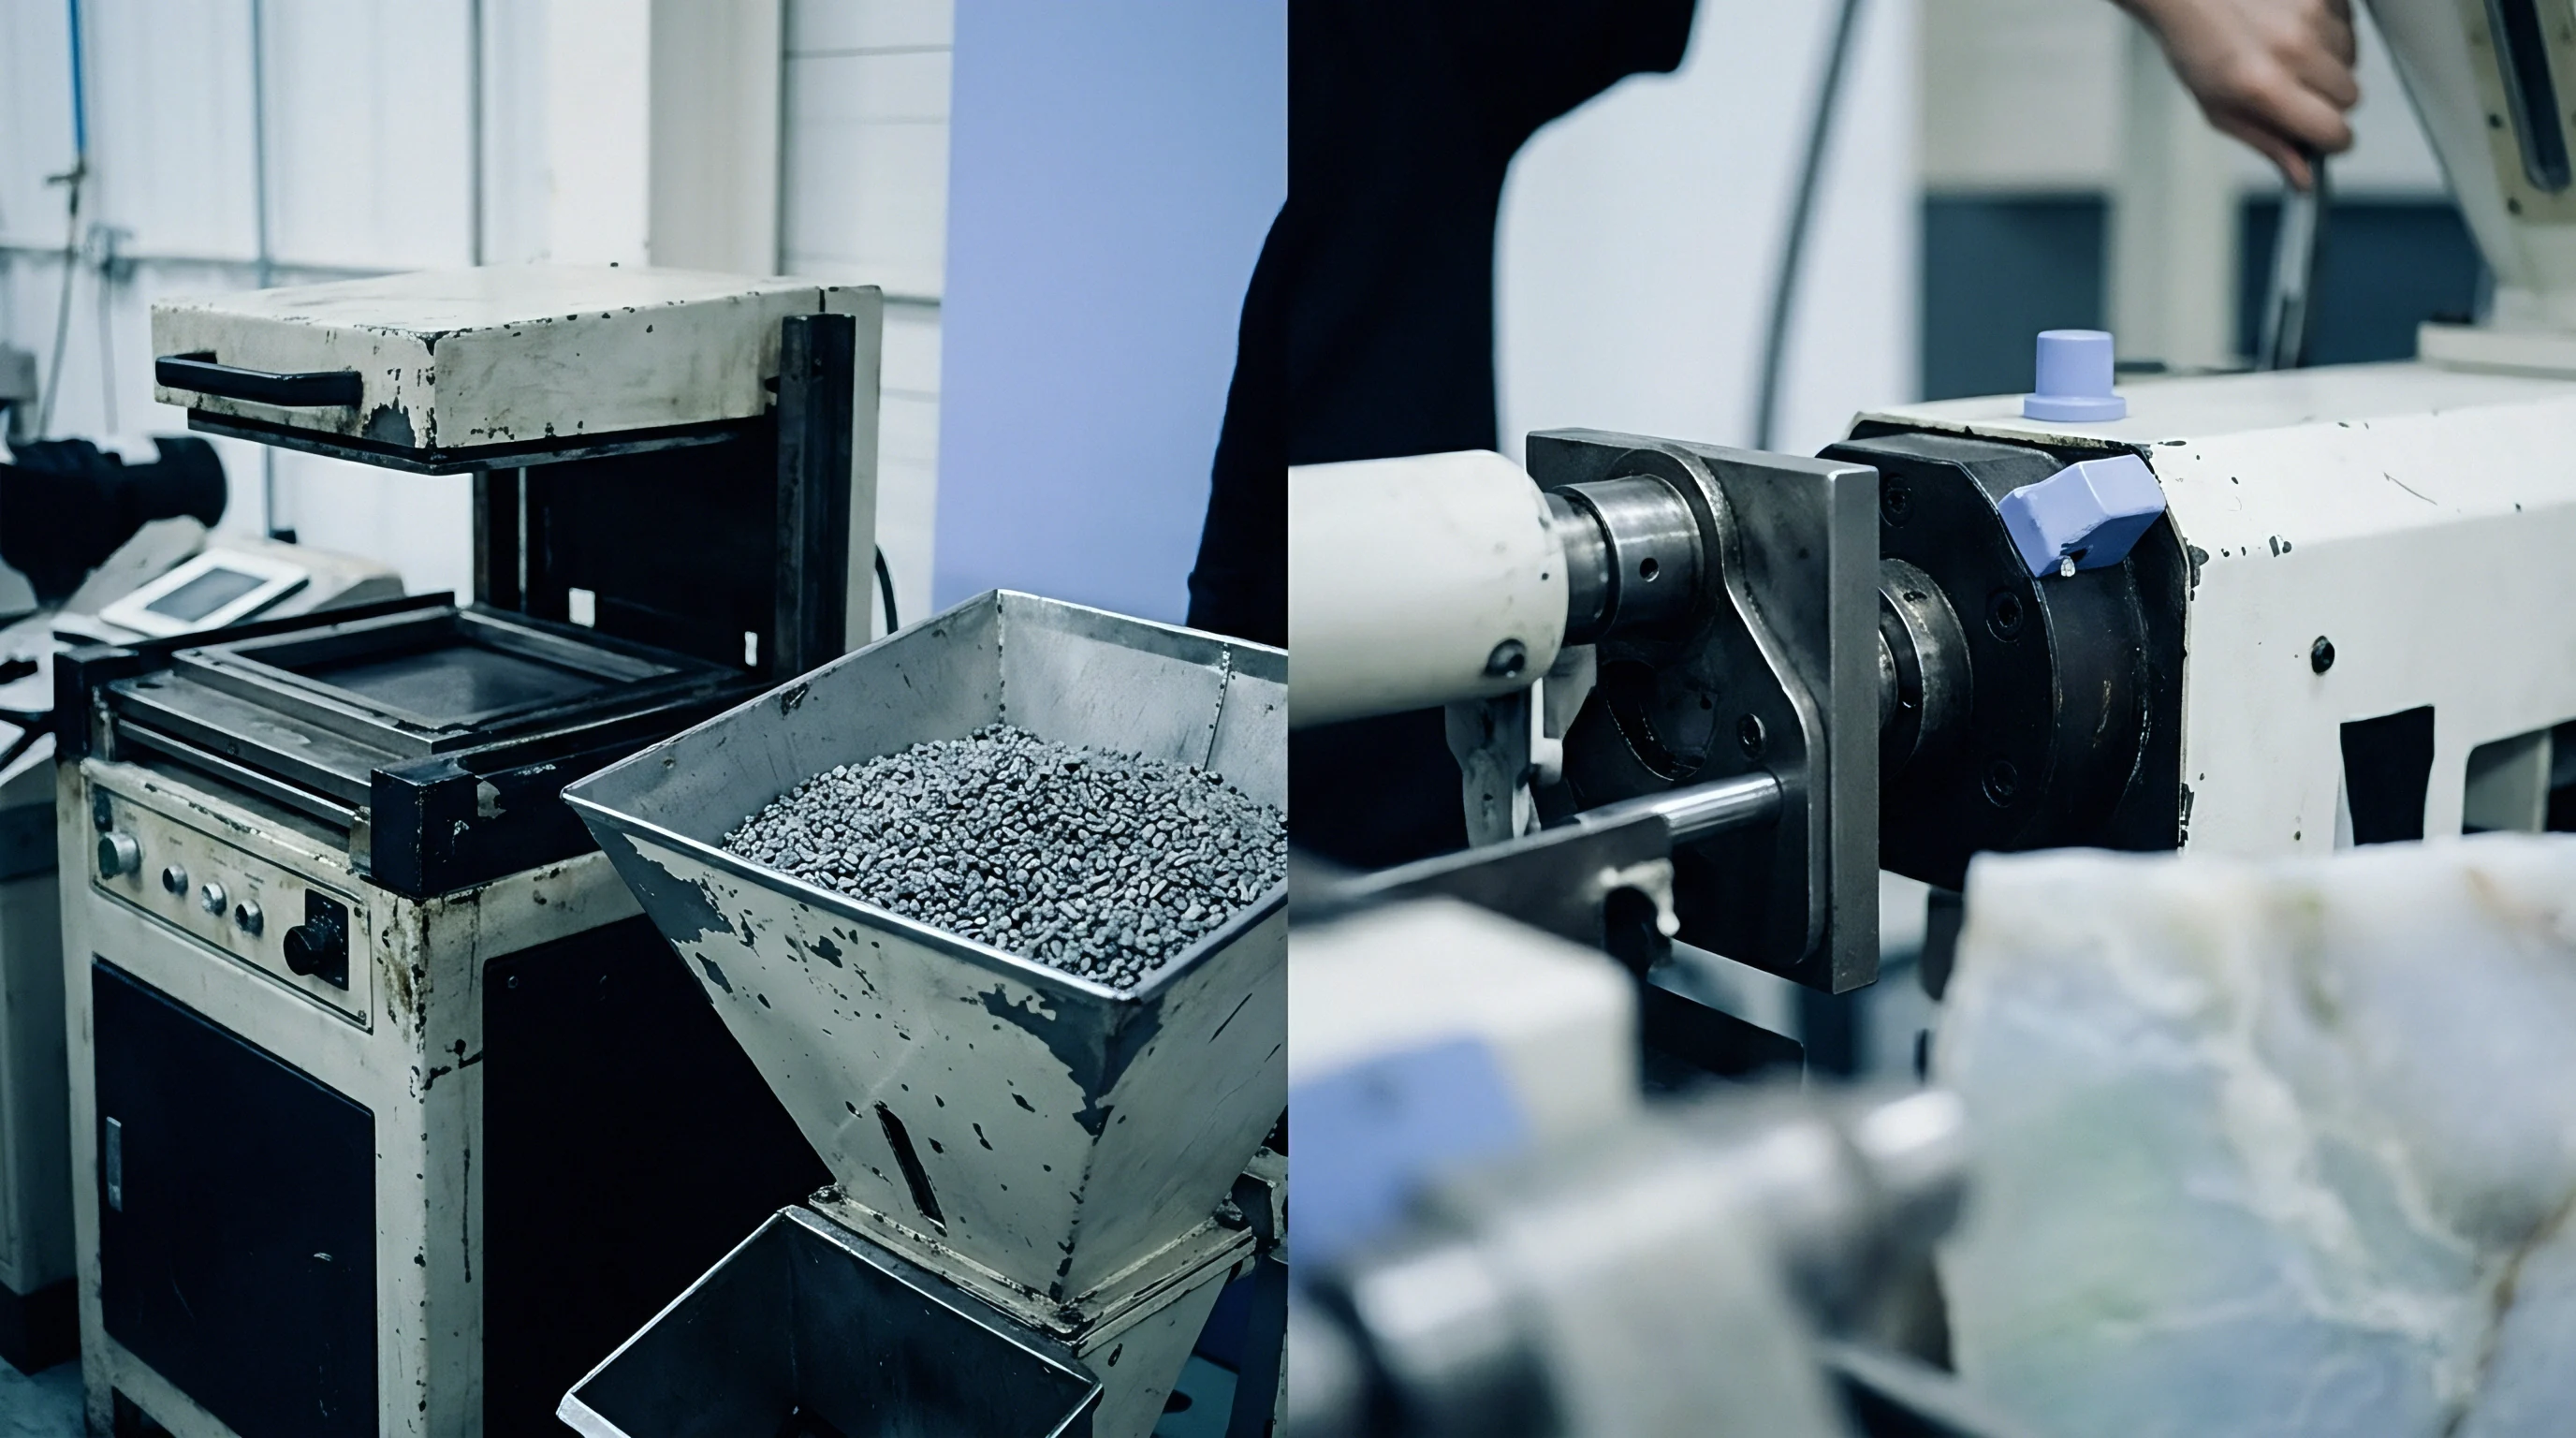
Carbon Black Absorption and Scattering Limits
Dark pigment loadings exceeding 0.5 percent by weight quench the backscattered illumination completely, preventing photon return to the spectrometer detector array. Gray, blue, and black post-consumer resins reduce optical penetration depth from several millimeters down to less than fifty micrometers. The incident beam interacts only with surface coatings and immediate external layers, failing to integrate the bulk volume of the pellet.
Extruder setups handling gray or dark post-consumer regrind require higher-intensity tungsten-halogen illumination sources or prolonged detector integration cycles. Increasing the exposure time from twenty milliseconds to two hundred milliseconds compensates for low photonic return, but limits the temporal resolution of the measurement system. Rapid composition swings occurring across several seconds go unrecorded when dark pigment loadings demand elongated integration periods.
- Carbon black particulate dispersion absorbs incident photonic energy uniformly across the near-infrared region, extinguishing diffuse reflectance above minimal loading thresholds.
- Titanium dioxide white pigment introduces severe Mie scattering that flattens hydrocarbon overtone peaks while artificially raising short-wavelength baseline values.
- Intra-pellet gas voids alter the effective optical path length, causing random swings in apparent absorption values without underlying chemical changes.
- Residual moisture condensation displays broad absorption bands near 1450 and 1940 nanometers that overlap secondary carbon-hydrogen overtone signals.

Flake Morphology and Bulk Density Fluctuations
Regrind materials introduce random void ratios as shredded flake geometries tumble past the optics alongside standard spherical pellets. Flakes create irregular air gaps. Bulk density shifts from 0.38 grams per cubic centimeter in raw shredded regrind to 0.54 grams per cubic centimeter in re-pelletized post-consumer compounds change the mean free path of light propagation.
Air voids between falling flakes scatter light without contributing hydrocarbon molecular absorption features. Spectrometer firmware compensates for this density variance through real-time path length normalization routines embedded in the preprocessing sequence. Signals failing minimum photon return thresholds trigger automatic discard algorithms, preventing corrupted scans from propagating into closed-loop control registers.
Neglecting optical attenuation from dark pigments leads to undetected resin mix shifts, producing brittle moulded components that fail quality audits and trigger costly field warranty claims.


Control
Continuous chemometric outputs drive real-time recipe shifts on the compounding line without requiring manual sample collection. In-line near-infrared spectrometers mounted at the feed throat calculate real-time predictions of melt flow rate, density, and polypropylene content every three seconds. Extruder backpressure shifts with viscosity.
Automated compounding systems adjust downstream additive feeder setpoints and gravimetric blend ratios to mitigate compositional fluctuations detected before the polymer reaches the extruder melting zones.
Closed-loop process integration pairs the spectrometer data stream with a programmable logic controller governing multi-component loss-in-weight feeders. When the feed throat sensor detects a 1.5 weight percent increase in polypropylene cross-contamination within the incoming post-consumer high density polyethylene stream, the control software commands an immediate ramp in functionalized ethylene-based impact modifier dosing. Dynamic compensation stabilizes mechanical properties in the compounded pellet output, safeguarding downstream blow molders against environmental stress crack failures.
Unstabilized post consumer polymer lots fluctuate in composition across single delivery containers.

Where Does Gravimetric Feedback Correct Optical Prediction?
Multi-component loss-in-weight feeders adjust their mass delivery rates as spectrometer software registers unannounced composition swings. Gravimetric blender controllers modify virgin polymer letdown ratios to buffer against melt index variations in the recycled feed. When post-consumer feed streams drift from a nominal melt flow rate of 0.8 grams per 10 minutes up to 1.6 grams per 10 minutes at 190 C / 2.16 kg, the gravimetric controller increases the ratio of fractional-melt virgin carrier resin, holding final product rheology inside specified tolerances.
Real-time compensation prevents processing downtime on high-speed blow molding and pipe extrusion lines. Traditional quality assurance relies on grab samples tested in an offline laboratory every four hours, during which an extruder operating at 1,500 kilograms per hour converts six metric tonnes of out-of-specification resin into scrap. In-line feed throat analytics shorten the detection and correction loop from four hours down to six seconds.
Line operators reject variable silos.
| Detected Feed Deviation | Measurement Threshold | Automated Feeder Response | Corrective Additive Chemistry |
|---|---|---|---|
| Elevated Polypropylene Fraction | Exceeds 2.0 wt% PP | Increase block copolymer doser by 1.5 wt% | Styrene-ethylene-butylene-styrene or POE |
| Depressed Melt Mass-Flow Rate | Falls below 0.35 g/10 min | Ramp peroxide masterbatch feed by 0.05 wt% | 2,5-dimethyl-2,5-di(tert-butylperoxy)hexane |
| Elevated Melt Mass-Flow Rate | Exceeds 1.20 g/10 min | Increase fractional virgin HDPE feed by 10 wt% | 0.05 MI ethylene-hexene copolymer |
| Inorganic Ash Spike | Exceeds 3.5 wt% mineral | Reduce chalk masterbatch letdown proportionally | Untreated calcium carbonate baseline balance |
| Surface Moisture Ingress | Exceeds 300 ppm H2O | Trigger vacuum vent pump booster in Zone 4 | Physical devolatilization via vacuum extraction |

Commercial Lot Segregation and Landed Economics
Sourcing post-consumer high density resin at a fifteen percent discount compared to virgin polymers introduces financial penalties when cross-polymer impurities trigger process line shutdowns. Sourcing teams leverage continuous feed throat spectroscopic logging as an objective incoming inspection tool. Extruder-mounted spectrometers log every metric tonne processed, generating a digital composition certificate across entire 25-tonne bulk delivery containers.
Contamination drives scrap rates upward.
Disputes regarding supplier compliance with ASTM D7611 purity standards resolve rapidly through time-stamped spectroscopic logs. When an incoming delivery billed as 98 percent pure high density polyethylene displays consistent five percent polypropylene inclusions across three consecutive hours of feeding, buyers issue automated debits based on landed cost differentials. Real time data protects downstream moulds.
Sourcing managers write binding purity limits directly into supply agreements, requiring compounders to maintain real-time spectroscopic monitoring at the feed throat as a qualification condition for preferred vendor status. Incorporating ASTM D7611 purity benchmarks into purchase contracts converts subjective contamination claims into binding debit notes against incoming railcar shipments.