Differential Thermal Analysis Protocols for Detecting Recycled Polymer Blends
Differential thermal analysis detects recycled polymer adulteration by identifying secondary melting endotherms and quantifying oxidation induction time shifts.
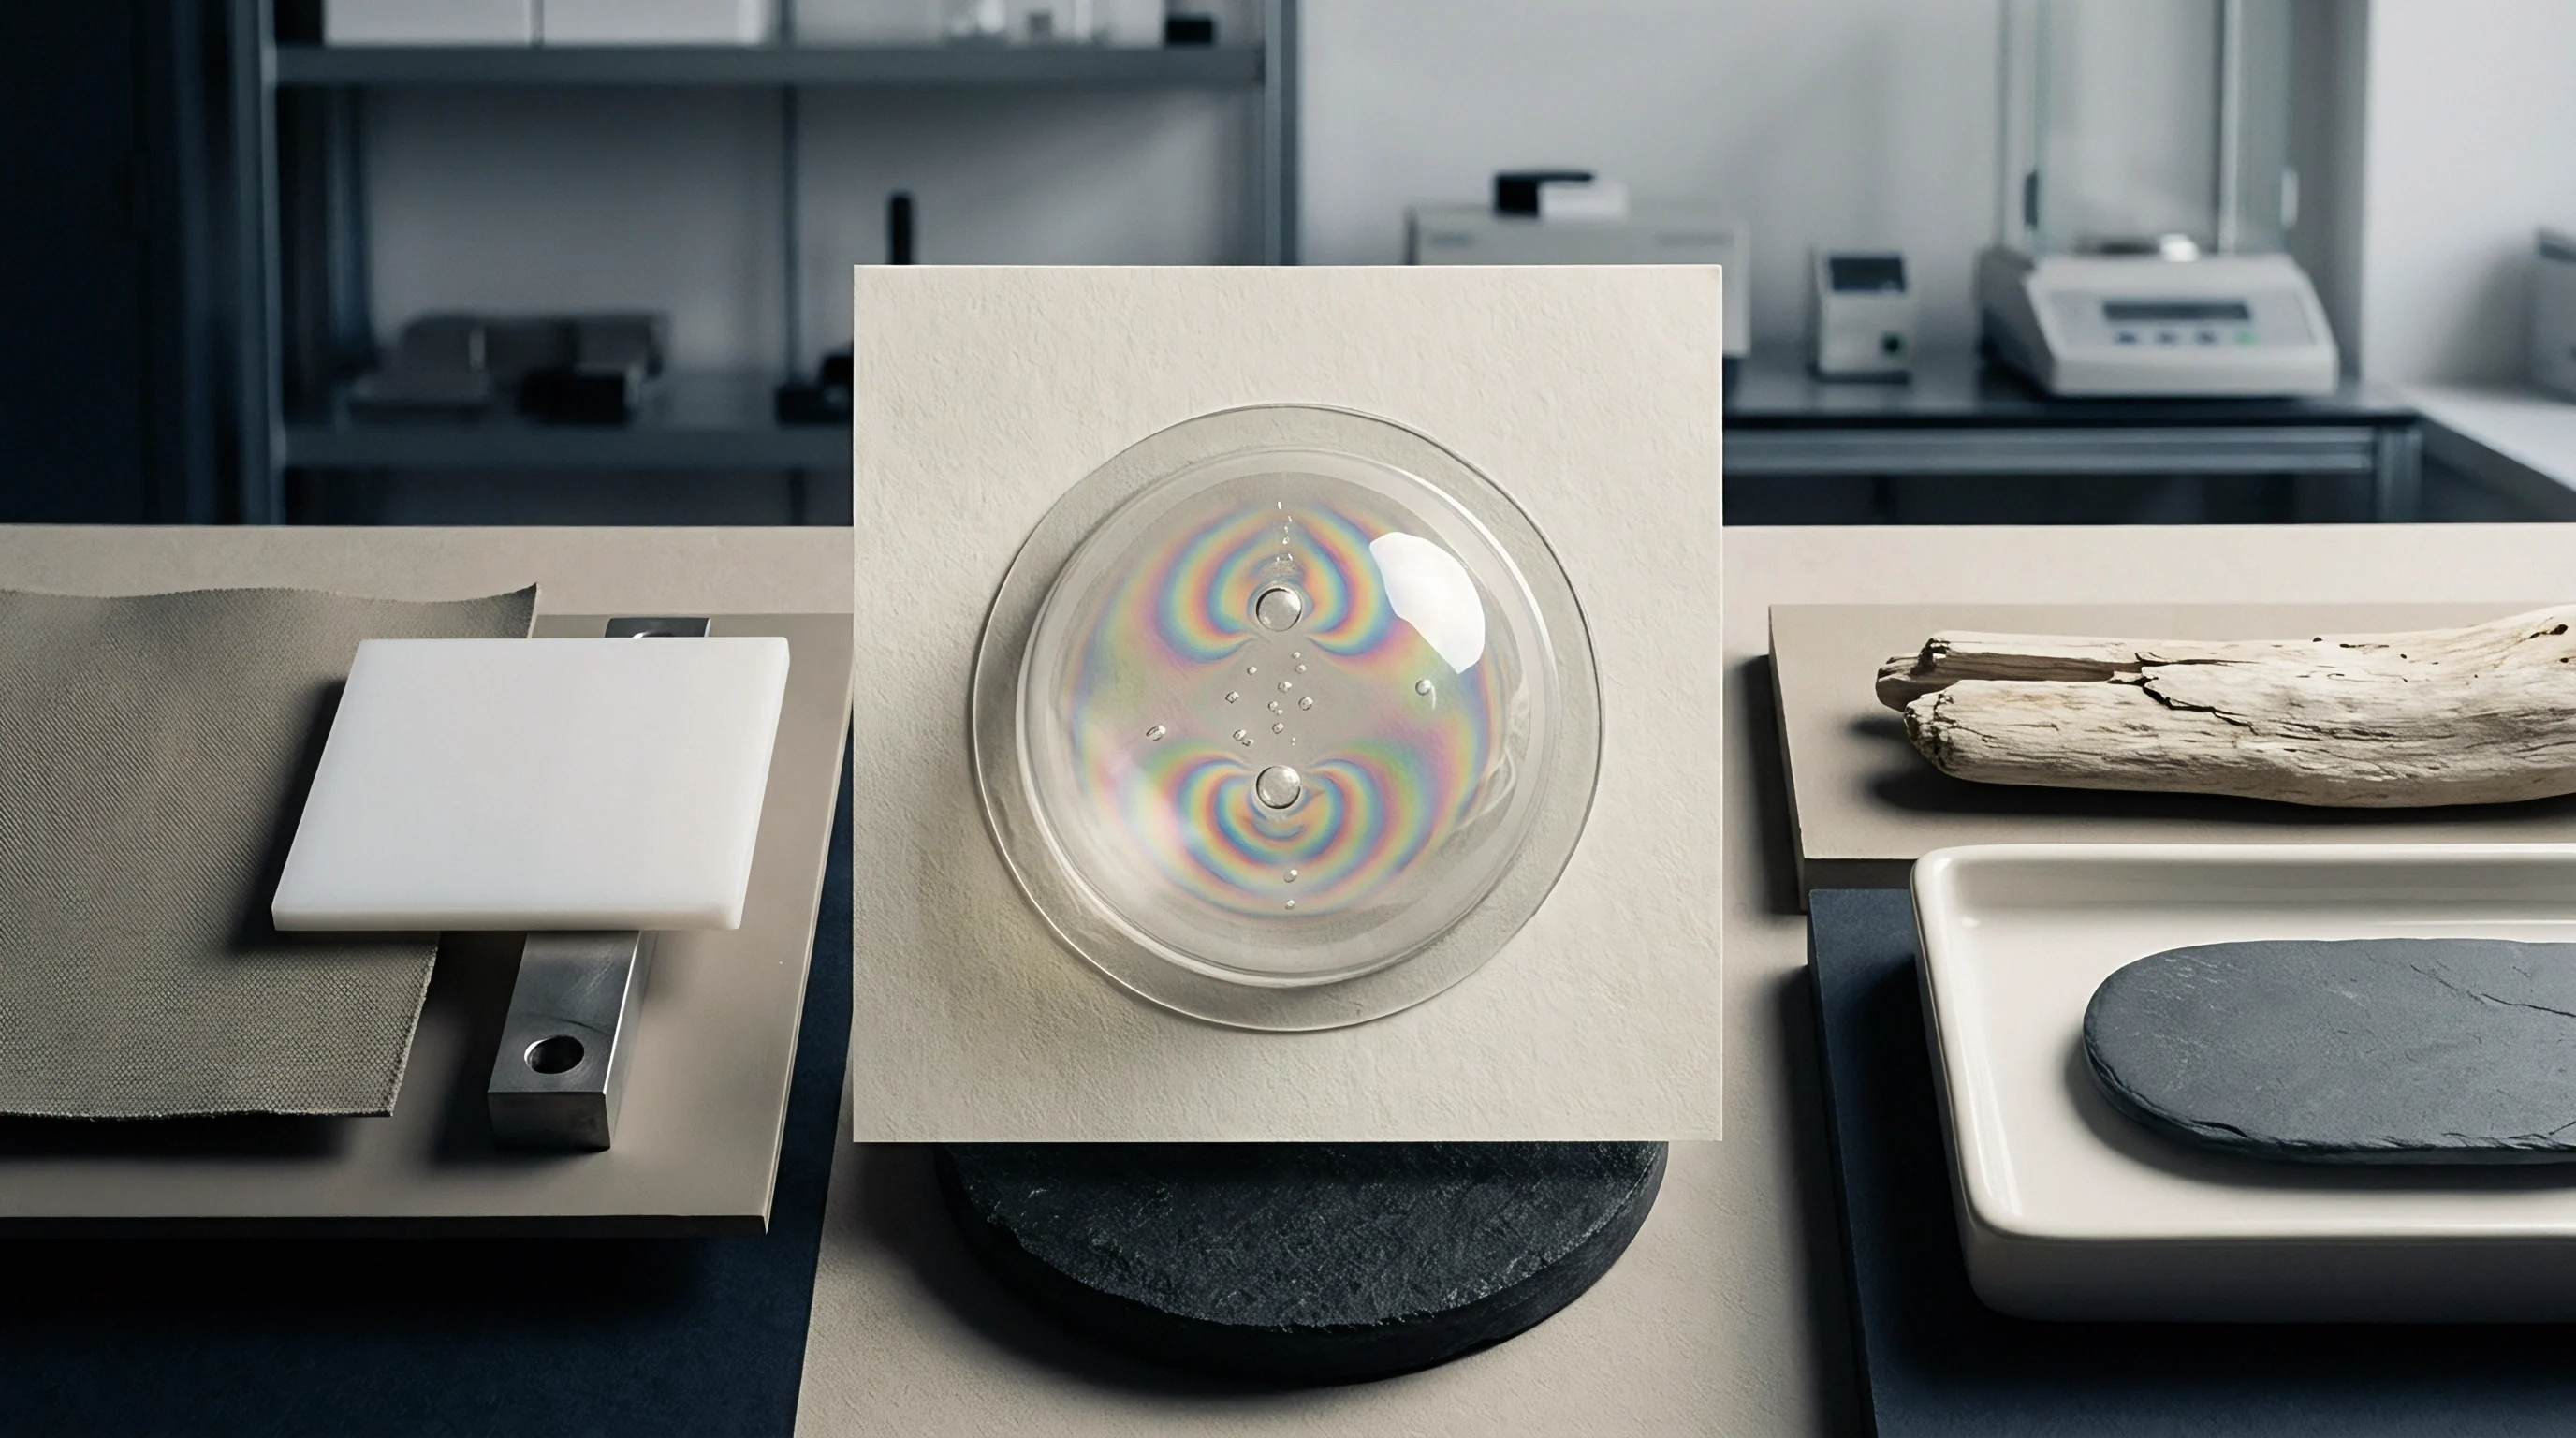
Pan
Ten milligrams of translucent pellets sit on the microbalance with a certified melt flow rate of 2.1 grams per ten minutes under 2.16 kilograms at 230 degrees Celsius. The supplier invoice lists pure virgin homopolymer polypropylene. A technician places the cut sample inside a standard forty-microliter aluminum crucible, lowers the mechanical press, and cold-welds the lid into position.
The crimp hermetically seals the specimen. When loaded into a differential scanning calorimeter cell alongside an empty reference vessel, that cold-formed capsule bears the mechanical duty of heat transfer between the silver furnace block and the polymer core. The physical contact area dictates thermal lag, baseline curvature, and the instrument’s ability to resolve trace secondary melting endotherms caused by unannounced post-consumer additions.
Thermal verification of recycled polymeric compounds depends on accurate signal baseline resolution. Post-consumer polymer streams arrive heavily contaminated with secondary polyolefins. Sorters routinely pass two to seven percent high-density polyethylene through automated near-infrared flake sorting lines into recycled polypropylene fractions.
Virgin resin brokers take advantage of wide price spreads by cutting prime lots with these recycled lots. Standard melt flow rate tests fail to expose this adulteration because compounders adjust peroxide concentrations to shift the bulk viscosity into the target specification window. Differential thermal analysis records the thermodynamic phase transitions of each polymer species within the matrix, exposing foreign crystalline phases regardless of viscosity modification.
A secondary endothermic peak area exceeding 0.8 Joules per gram at 126 degrees Celsius in a polypropylene matrix indicates post-consumer polyethylene contamination above one weight percent.
Sample preparation dictates the resolution of secondary thermal signatures. Pellets must undergo microtome cross-sectioning rather than rough diagonal wire cutting. Shearing pellets with dull hand blades induces localized strain hardening, alters lamellar crystal thickness, and broadens low-temperature melting tails.
Laboratories maintain specimen thickness between 0.5 and 0.8 millimeters to optimize thermal diffusion across the polymer cross section. Thick samples create internal thermal gradients exceeding two degrees Celsius at standard heating rates of ten Kelvin per minute. These gradients smear small thermal events across wider temperature intervals, hiding minor contaminant peaks beneath the primary melting shoulder.
Pan geometry influences peak resolution directly. Flat-bottom aluminum crucibles deliver reproducible thermal resistance values when seated squarely on the constantan sensor stage. Deformed pan bottoms alter the thermal time constant of the measuring cell, producing baseline drift that obscures minor endothermic events below five Joules per gram.
Sealed crucibles containing pinhole lids allow volatile release without sensor contamination. Unwashed post-consumer recyclate frequently carries residual moisture, printing ink solvents, and degraded short-chain oligomers. In unvented pans, internal vapor pressure distorts the sample geometry and produces sharp, irregular endothermic spikes between 90 and 110 degrees Celsius that mimic branched polymer melting transitions.
| Polymer Species | Expected Matrix | Peak Temperature Range | Heat of Fusion Reference | Detection Limit |
|---|---|---|---|---|
| High-Density Polyethylene | Polypropylene Homopolymer | 124 C to 132 C | 293 J/g | 0.5 wt% |
| Linear Low-Density Polyethylene | Polypropylene Copolymer | 118 C to 125 C | 293 J/g | 0.8 wt% |
| Low-Density Polyethylene | High-Density Polyethylene | 106 C to 112 C | 293 J/g | 1.5 wt% |
| Polyethylene Terephthalate | Polybutylene Terephthalate | 248 C to 258 C | 140 J/g | 0.3 wt% |
| Polyamide 6 | Polyamide 66 | 215 C to 223 C | 230 J/g | 0.4 wt% |
Temperature calibration protocols establish the baseline confidence of every recorded thermogram. Indium standards verify temperature calibration. High-purity zinc and tin verify sensor linearity across the operating range from 25 to 350 degrees Celsius.
Running temperature calibration routines with poorly crimped calibration pans introduces thermal resistance errors that shift recorded transition peaks by up to 1.8 degrees Celsius. That error margin erases the distinction between linear low-density polyethylene and low-density polyethylene contaminants in polyolefin compounds. The compounding vendor asserts that slight shift variances reflect nothing more than differing catalyst packages across primary reactor trains.


Signal
Sensor output registers differential heat flow in milliwatts across the thermocouple platform as the sample cell ramps through programmed thermal ramps. The recorded trace represents the sum of sensible heat capacity changes and latent heat absorbed or released during phase transformations. Virgin polyolefins produce smooth, uniform melting endotherms reflecting narrow crystal size distributions achieved in modern polymerization reactors.
Recycled materials introduce multiple melting peaks, asymmetric peak broadening, altered crystallization onset points, and depressed oxidation induction temperatures caused by thermal degradation cycles inside previous compounding extruders.

How Do Heating Rates Alter Detection Sensitivity?
Thermal ramp rates dictate the separation of closely spaced endothermic events. Fast ramp rates at twenty to forty Kelvin per minute amplify the magnitude of the heat flow signal, making minor phase transitions easier to distinguish from instrument background noise. Fast ramp rates reduce thermal resolution.
The temperature lag between the sensor thermocouple and the polymer core increases proportionally with the heating rate, causing overlapping melting peaks to merge into single broad distributions. A ten Kelvin per minute ramp rate balances signal amplitude against peak separation when inspecting incoming lots for unknown post-consumer polymer fractions.
Cooling curve crystallization peaks shift toward higher temperatures when nucleating degradation residues contaminate recycled feedstocks.
Purge gas selection governs the chemical stability of the polymer melt during thermal analysis. Nitrogen gas sweeps pyrolytic volatiles away. Ultra-high-purity nitrogen containing less than two parts per million oxygen prevents sample oxidation during the first and second heating scans.
Operating thermal protocols under air purges during heating cycles triggers premature chain scission and cross-linking in degraded post-consumer materials, generating exothermic baseline drift that masks high-temperature melting events. The purge gas flows at fifty milliliters per minute across the cell. Variations in gas velocity alter the convective heat loss from the sample stage, introducing artificial slope variations across the recorded baseline.
Thermal analysis protocols reveal multiple distinct failure modes and contamination signatures during incoming resin inspection:
- Secondary melting endotherms appear in the 120 to 130 degrees Celsius interval, confirming the presence of unseparated polyethylene inside nominal polypropylene homopolymer compounds.
- Premature crystallization exotherms occur at elevated temperatures during controlled cooling cycles, driven by heterogeneous nucleating agents and pigment residues common in recycled fractions.
- Bimodal crystal distributions broaden the primary melting peak by more than eight degrees Celsius, revealing inconsistent molecular weight distributions caused by mixing different melt flow index regrind lots.
- Depressed oxidation induction time values under isothermal testing at 200 degrees Celsius expose severe stabilizer depletion, leaving the resin vulnerable to cracking during product service.
Physical aging alters the glass transition and low-temperature enthalpy relaxation of condensation polymers. Recycled polyethylene terephthalate and polybutylene terephthalate accumulate physical aging during storage in uncontrolled warehouse environments. Glass transition temperatures shift upward by two to four degrees Celsius when enthalpy relaxation peaks superimpose on baseline heat capacity steps.
Evaluating samples without erasing this relaxation history produces false reports of additive contamination. Overlooking minor second-phase melting artifacts leads directly to tool fouling, variable shrinkage across cavity rows, and delayed stress cracking under environmental exposure.
Enthalpy
Peak area integration yields the latent heat of fusion associated with crystal melting. Calculating the mass fraction of a recycled component inside a host polymer matrix requires dividing the measured melting enthalpy of the contaminant phase by the reference enthalpy of fusion for a theoretical one hundred percent crystalline sample of that pure species. ASTM D3418 and ISO 11357-3 provide standard reference values: 293 Joules per gram for high-density polyethylene and 207 Joules per gram for isotactic polypropylene.
The calculation yields the crystalline mass fraction rather than the total contaminant mass fraction. Accurate total mass quantification requires dividing the crystalline fraction by the typical degree of crystallinity of the target contaminant grade.
Polypropylene melts between 160 C and 168 C. The secondary peak appears at 124 C. Integrating the secondary peak between 110 and 135 degrees Celsius yields the enthalpy of the polyethylene contaminant. Take a commercial compound supplied as prime injection moulding polypropylene with a 12 melt flow index. If peak integration of the 124 degrees Celsius endotherm yields 4.2 Joules per gram, dividing by 293 Joules per gram yields a crystalline polyethylene mass fraction of 0.0143.
Assuming a standard post-consumer high-density polyethylene crystallinity of sixty percent, dividing 0.0143 by 0.60 yields an estimated total polyethylene contamination level of 2.38 weight percent inside the nominal polypropylene matrix.
Thermal history erasure during the initial heating cycle prevents ambient storage crystallization from masquerading as processing degradation.
Executing accurate integration demands rigorous thermal cycling. The laboratory performs standard three-stage thermal analysis sequences:
- The cell heats the specimen from 25 to 210 degrees Celsius at ten Kelvin per minute to document the as-received thermal state and crystalline morphology.
- The instrument holds the specimen at 210 degrees Celsius for five minutes under nitrogen to eliminate mechanical stress and residual crystalline seeds.
- The cell cools ten Kelvin per minute down to 25 degrees Celsius to measure crystallization kinetics, nucleation temperatures, and exothermic peak profiles.
- The second heating scan eliminates processing history by repeating the thermal ramp to 210 degrees Celsius to evaluate intrinsic thermodynamic properties without moulding artifacts.
Recycled fractions widen the melting window. Thermal degradation shifts molecular weight distributions toward lower values through beta-scission mechanisms during repeated extruder passes. Low molecular weight polymer chains crystallize into thinner lamellae that melt at lower temperatures than primary high molecular weight structures.
The primary melting peak develops a pronounced low-temperature shoulder extending ten to twenty degrees below the nominal peak maximum. Peak deconvolution software separates the primary peak from the secondary degradation shoulder using Gaussian-Lorentzian fitting algorithms. Integrating the deconvoluted degradation shoulder reveals the volumetric fraction of scissioned chains within the compound.
| Lot Designation | MFR (2.16 kg, 230 C) | PP Melting Enthalpy | PE Contaminant Enthalpy | Calculated PE Fraction | Impact Strength (ISO 179) |
|---|---|---|---|---|---|
| Virgin Prime Reference | 12.2 g/10 min | 98.4 J/g | 0.0 J/g | 0.0 wt% | 4.2 kJ/m² |
| Suspect Compound A | 14.8 g/10 min | 94.1 J/g | 1.8 J/g | 1.0 wt% | 3.8 kJ/m² |
| Suspect Compound B | 19.5 g/10 min | 88.6 J/g | 5.6 J/g | 3.2 wt% | 3.1 kJ/m² |
| Industrial Recyclate C | 28.4 g/10 min | 76.2 J/g | 14.8 J/g | 8.4 wt% | 2.2 kJ/m² |
| Post-Consumer Grade D | 34.1 g/10 min | 68.9 J/g | 28.5 J/g | 16.2 wt% | 1.7 kJ/m² |
| Methods note: Enthalpy evaluated from second heating scan at 10 K/min under nitrogen purge. PE content calculated using 293 J/g theoretical 100% crystalline enthalpy and 60% baseline crystallinity. | |||||
Contamination drops tensile yield by twelve percent. Phase separation between immiscible polyolefin phases generates microstructural voids along boundary layers under mechanical load. When post-consumer polyethylene blends into homopolymer polypropylene without compatibilizers, the polyethylene droplets coalesce into discrete spherical domains measuring two to fifteen micrometers across.
These domains act as stress concentration points under tensile and impact stresses. Differential thermal analysis quantifies the phase volume of these foreign domains before moulders load raw pellets into production hoppers, preventing catastrophic field failures. Whether fast-scanning nanocalorimetry can isolate highly miscible low-molecular-weight recycled fractions in commercial polyolefin grades remains an open technical challenge.

Baseline
Constructing the integration baseline requires selecting proper mathematical boundaries across the heat flow curve. The technician chooses between linear, horizontal, and sigmoidal baseline models based on the heat capacity shift between the solid state below the melting transition and the liquid state above completion. Semicrystalline polymers exhibit a noticeable step change in heat capacity across melting transitions because the amorphous melt absorbs more sensible heat per Kelvin than the crystalline solid.
Sigmoidal baselines track this heat capacity step accurately by proportioning the baseline displacement to the fractional area of the melting peak completed at each temperature increment.
Where Do Immiscible Fractions Hide Thermal Signals?
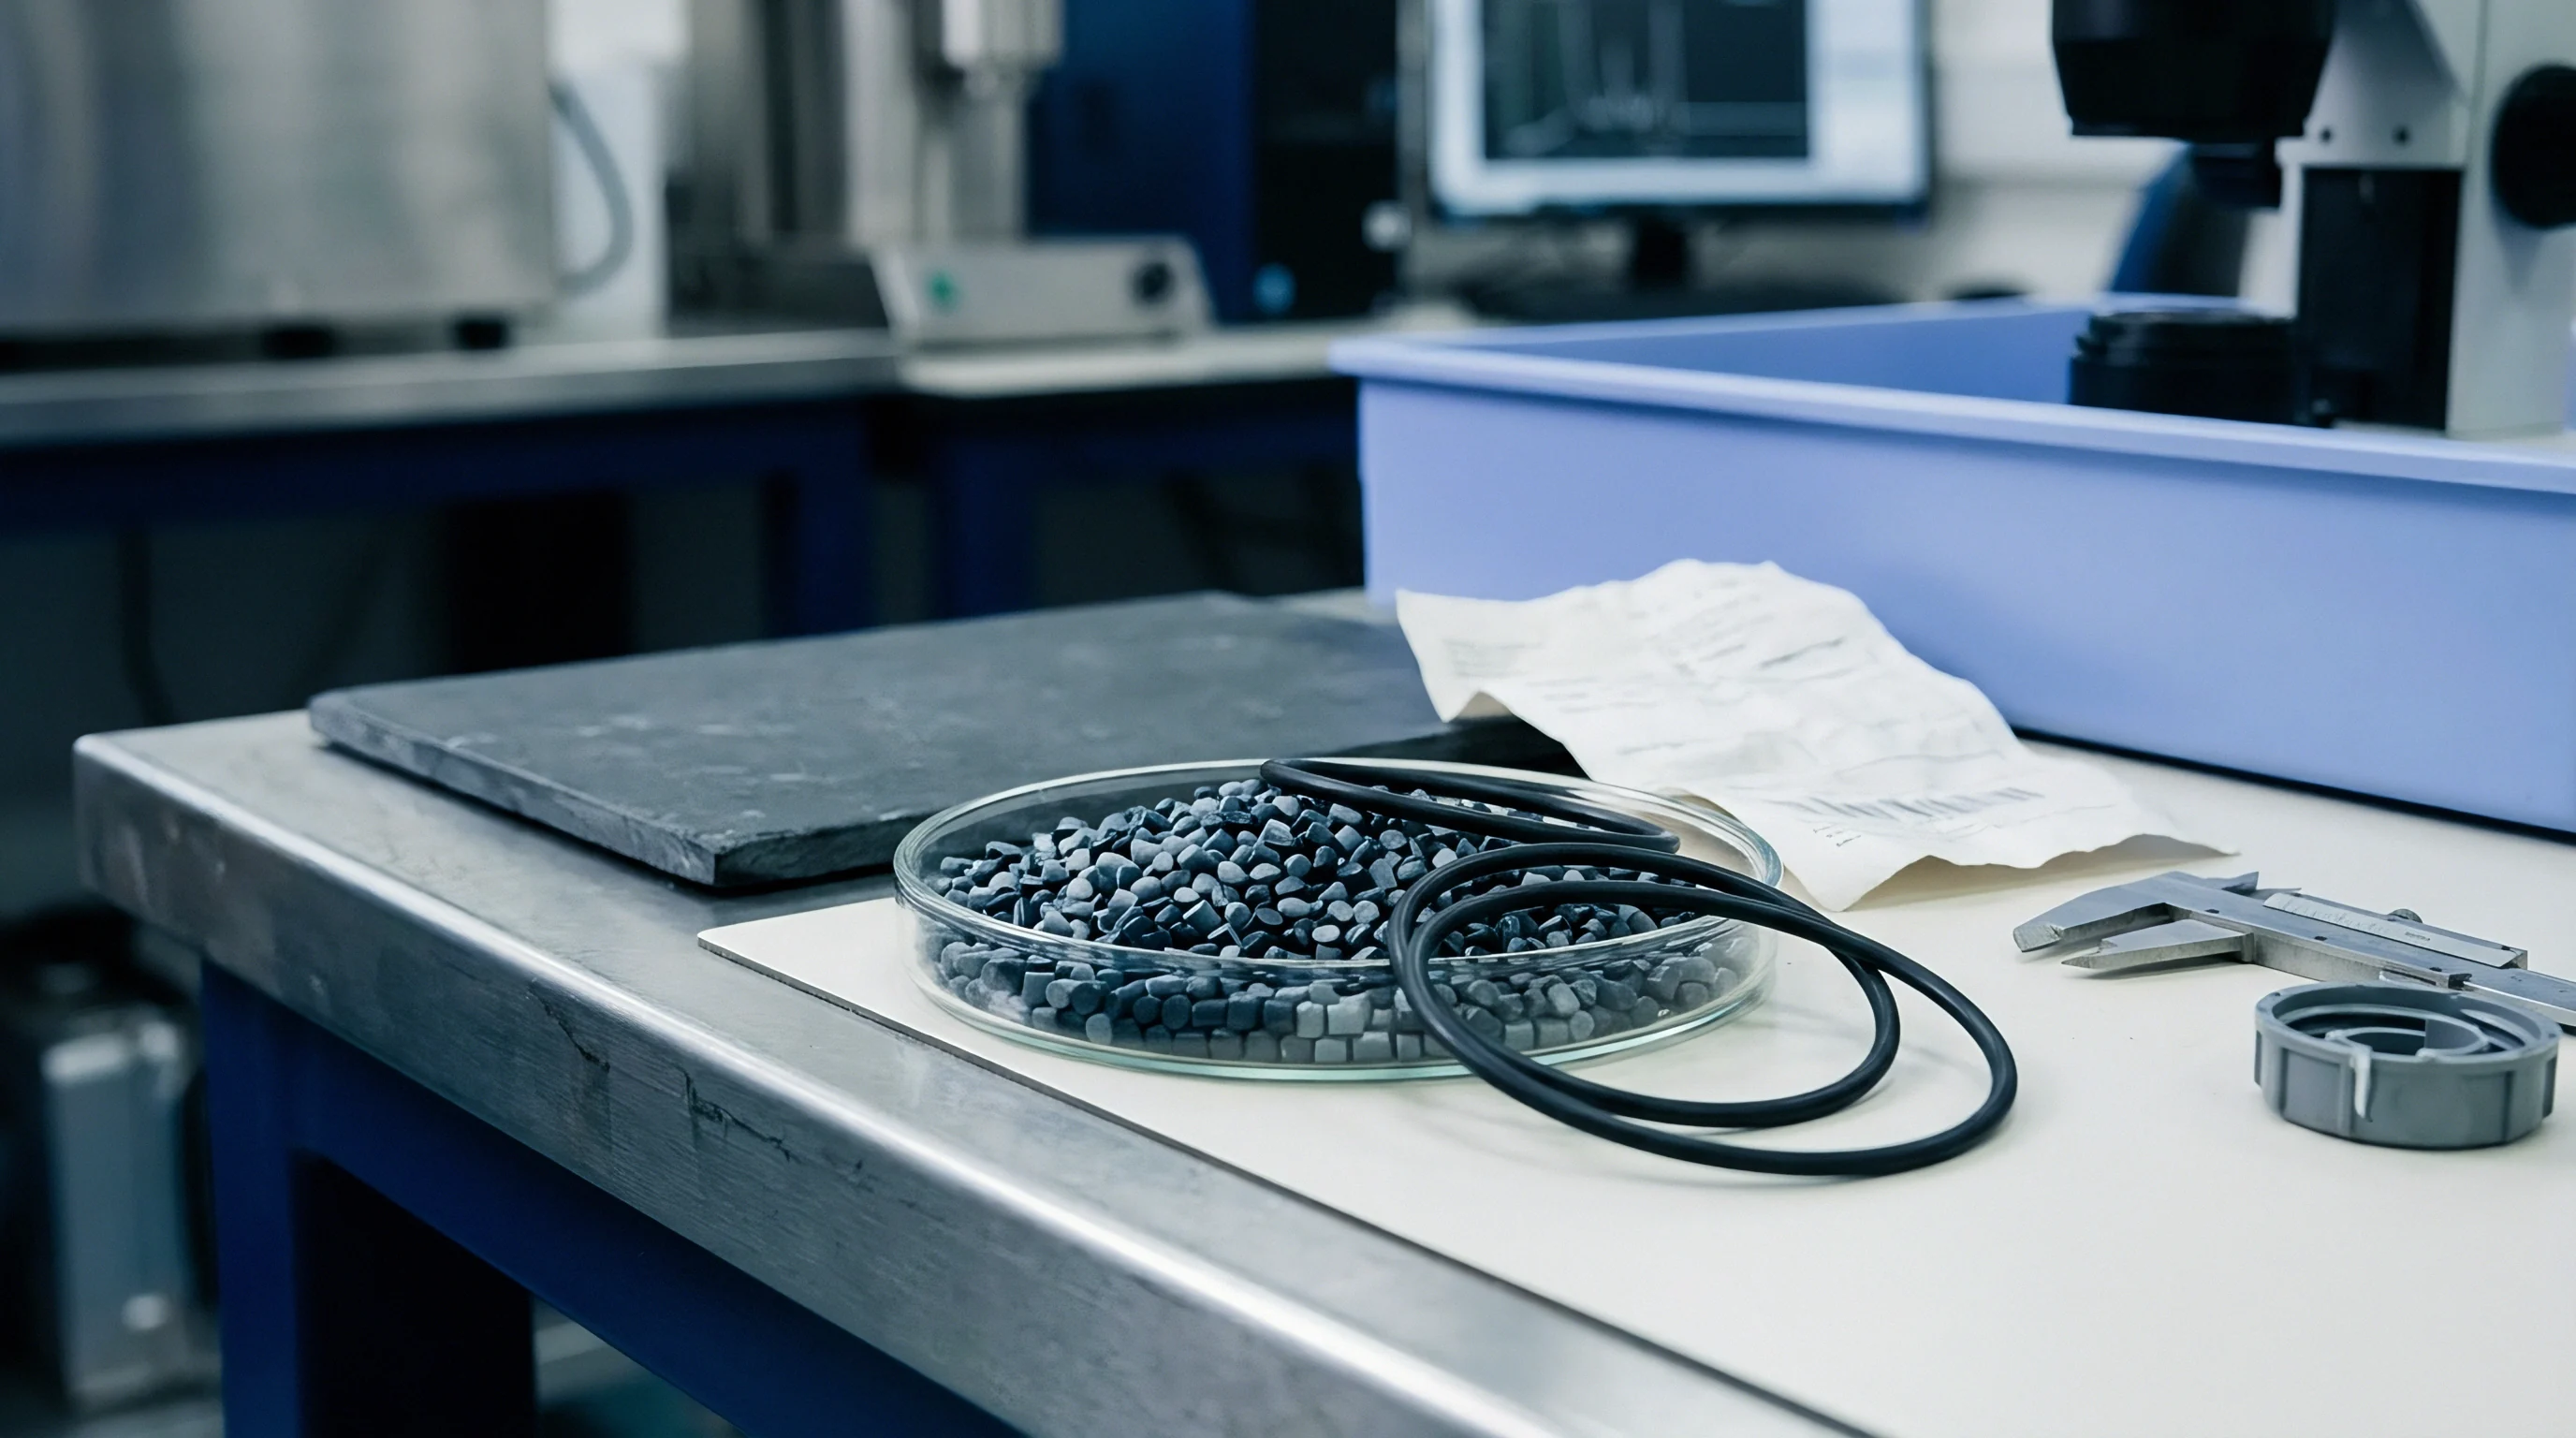
Low-concentration contaminant fractions hide beneath baseline noise when integration limits lack rigorous standardization. An analyst using a linear baseline drawn tightly between 120 and 132 degrees Celsius undercounts the high-density polyethylene enthalpy by excluding the diffuse melting tail that begins at 105 degrees Celsius. Recycled post-consumer polyethylene contains short-chain branching variations that broaden the melting initiation window.
Truncating the integration baseline at 120 degrees Celsius underestimates the true contaminant mass by up to forty percent, allowing non-compliant resin lots to pass incoming inspection tests.
Oxidation induction time tests operate under isothermal baselines to measure stabilizer longevity. The instrument heats the specimen to 200 degrees Celsius under pure nitrogen, stabilizes the thermal signal for five minutes, and switches the purge gas to pure oxygen at fifty milliliters per minute. The baseline remains flat until primary antioxidants undergo complete depletion, after which autocatalytic exothermic oxidation begins.
The oxidation induction time corresponds to the time interval between oxygen introduction and the tangent intersection point of the exothermic oxidation baseline. Virgin homopolymer polypropylene stabilized for automotive exterior parts delivers oxidation induction times exceeding forty minutes. Reprocessed post-consumer lots routinely show values below six minutes.
Unwashed labels release residual polyester traces. Incoming lot qualification protocols apply specific analytical criteria to evaluate suspect resin shipments:
- Secondary transition inspection mandates scanning the 100 to 140 degrees Celsius range for polyethylene endotherms and the 240 to 260 degrees Celsius range for polyester residues.
- Enthalpy ratio calculations establish whether the ratio of primary crystal melting to secondary peak areas remains within the contractually permitted tolerance envelope.
- Crystallization temperature verification identifies excessive nucleating masterbatch or particulate carbon black additions used to mask optical inconsistencies in regrind materials.
- Isothermal oxidation screening confirms the presence of active phenolic and phosphite antioxidant packages necessary to prevent degradation during conversion.
The compounding sector balances raw material margins against detection limits on a daily basis. Petrochemical refiners run polymerization reactors continuously, venting low-molecular-weight waxes and off-spec reactor flushes into holding ponds. Recyclers salvage these materials alongside shredded automotive battery casings and post-consumer milk bottles, homogenizing the lot inside continuous twin-screw compounding extruders.
The resulting pellet looks uniform, cuts cleanly, and meets bulk density specifications. The thermal trace retains the immutable thermodynamic record of every polymer chain inside the mix. A broad, asymmetrical melting tail indicates unwashed industrial scrap, whereas a sharp secondary satellite reveals post-consumer homopolymer contamination.
Dossier
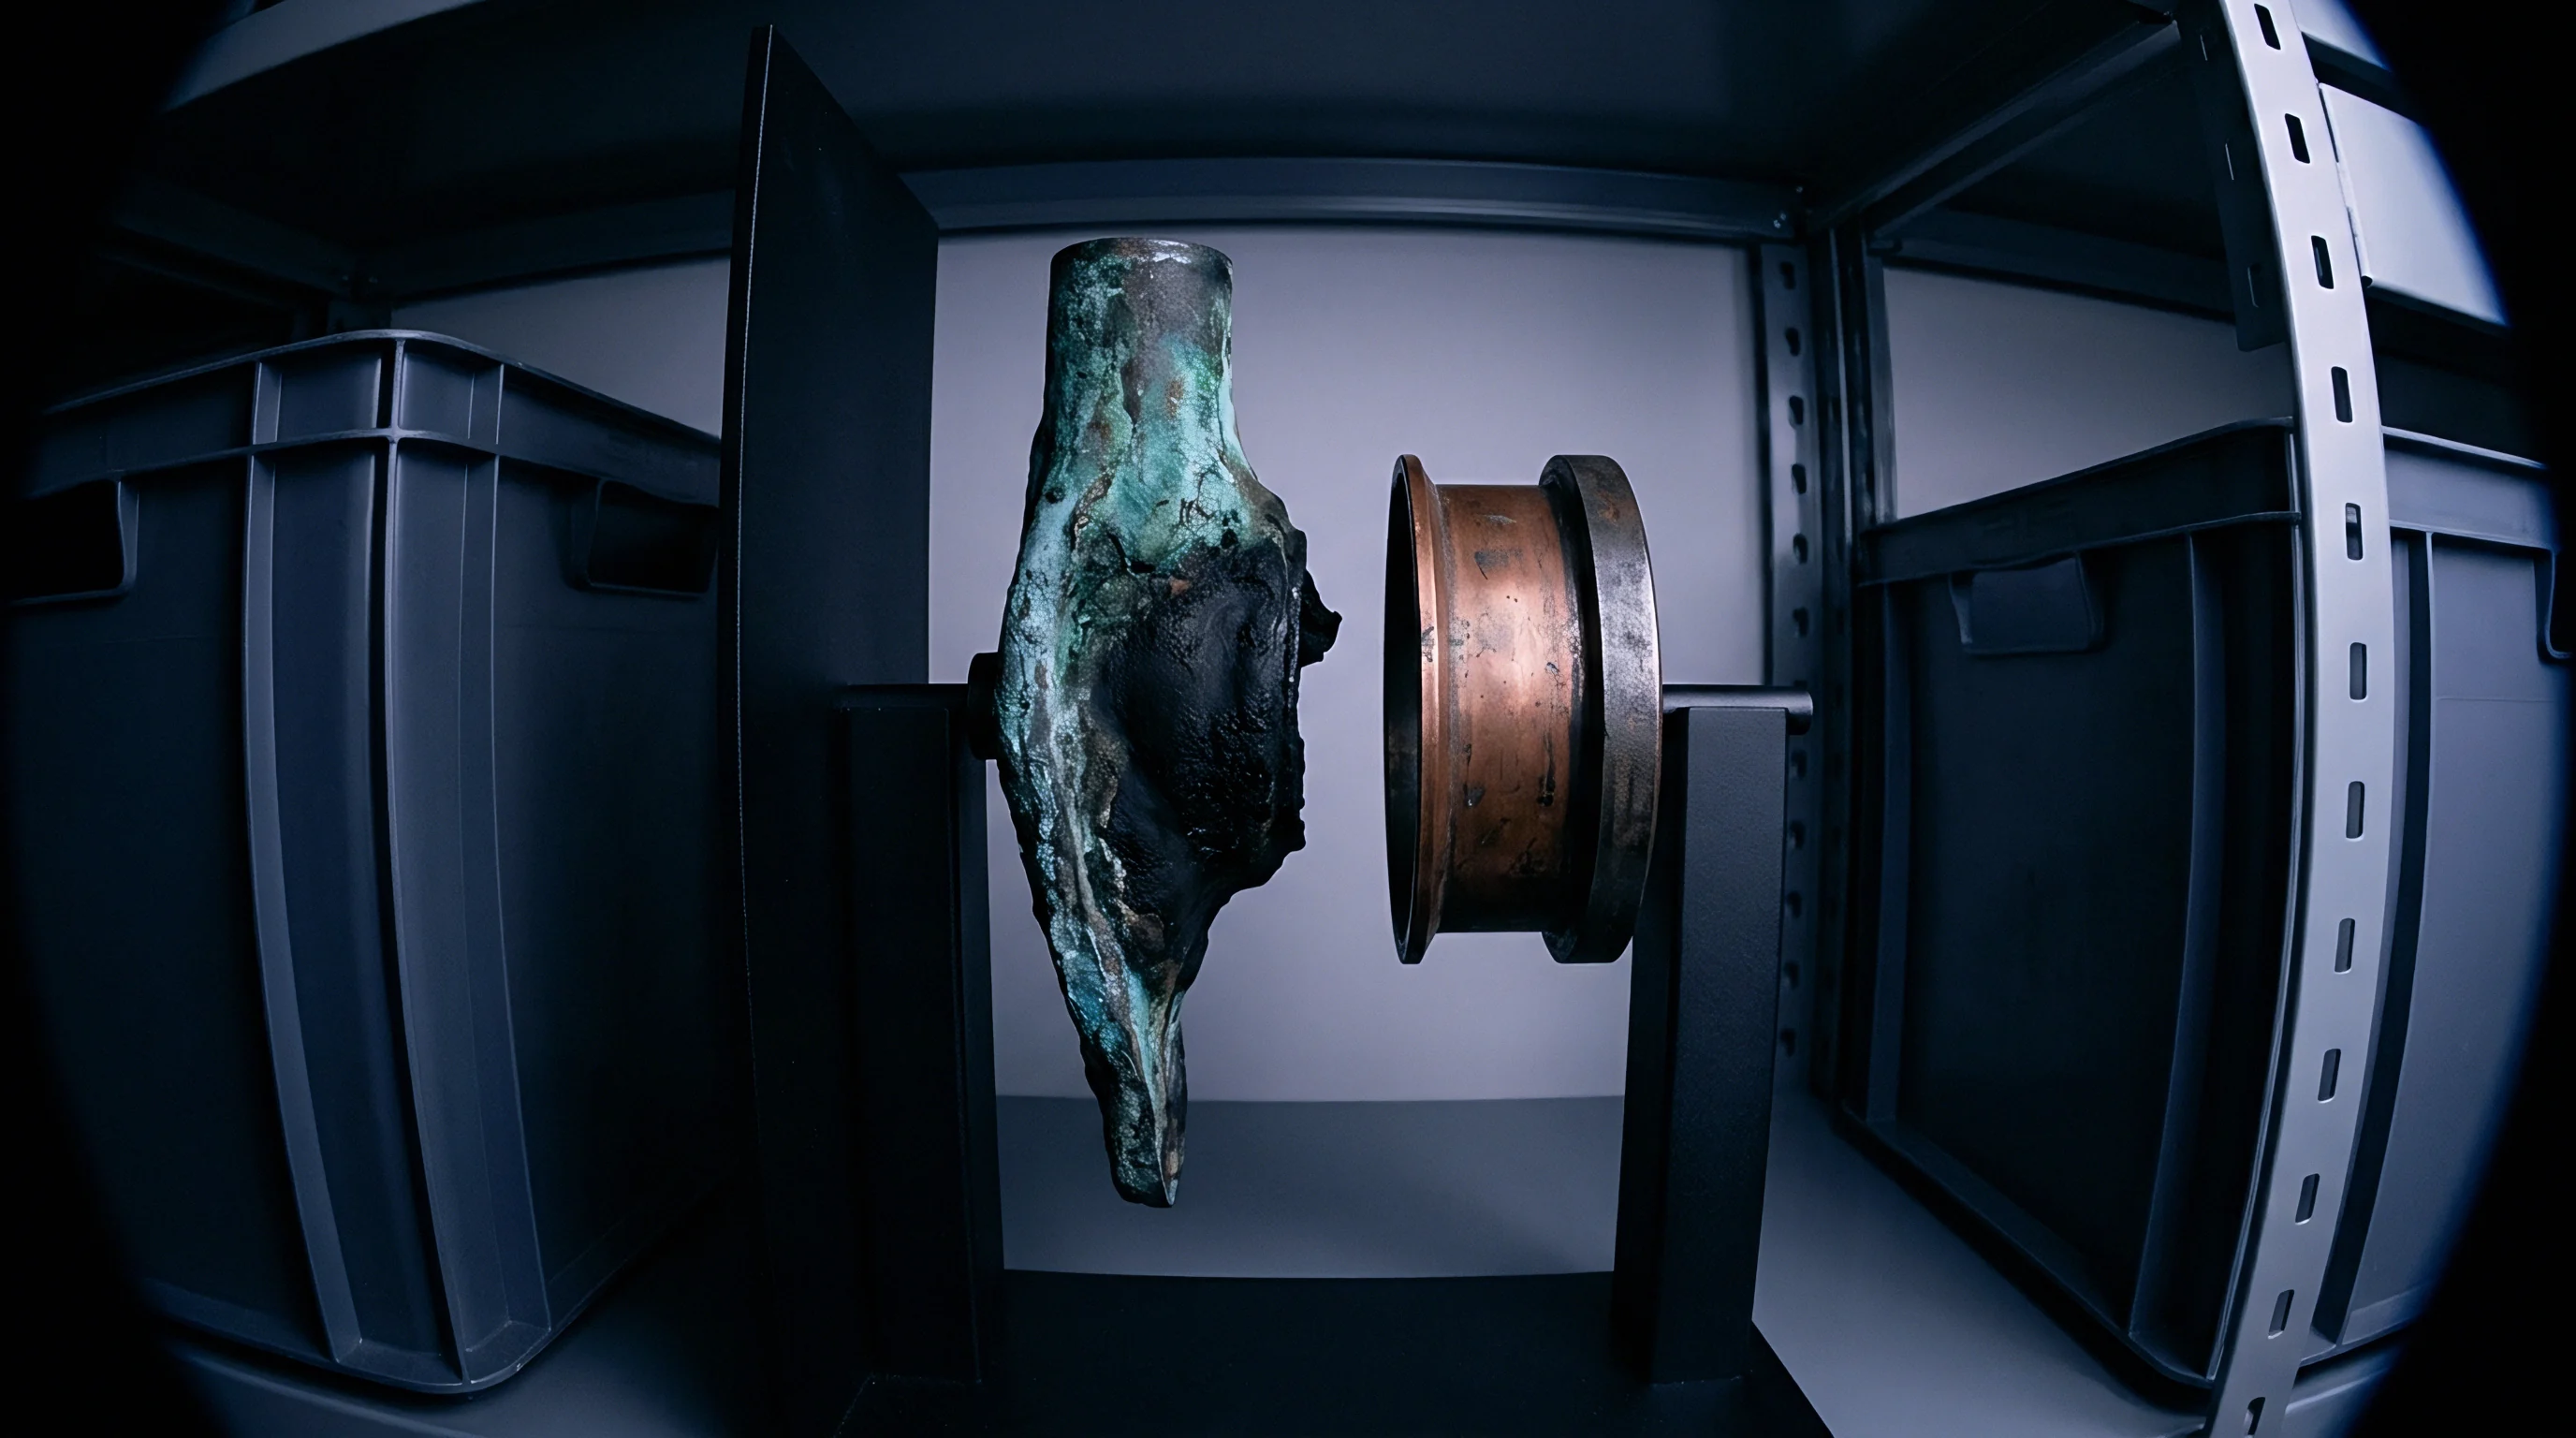
Receiving inspection procedures translate thermal analysis data into legally binding commercial acceptance documentation. Purchasing contracts written for technical plastic parts must specify the testing standard, heating rate, thermal cycling sequence, and maximum permissible secondary phase enthalpy. A purchase order citing pure prime virgin resin without defining thermal verification thresholds leaves the buyer without contractual recourse when parts fail drop impact testing.
Every incoming lot carries thermal liability. Adding explicit differential scanning calorimetry thresholds to the material qualification dossier enables quality engineers to reject adulterated shipments before railcars unload into plant silos.
Scrap rates escalate to eight percent. The financial impact of processing unverified recycled compounds reaches far beyond the raw pellet price spread. Virgin polypropylene currently commands a market price of 1,280 dollars per metric ton, while mixed post-consumer polyolefin regrind sells near 740 dollars per metric ton.
Compounders can undercut virgin spot prices by sixty dollars per metric ton while increasing their operating margin by blending ten to fifteen percent post-consumer regrind into virgin lots. The moulder experiences higher cycle times, irregular part warpage, inconsistent gate freeze-off, and mold venting deposits that demand tool cleaning every four thousand shots.
Incorporating ISO 11357-3 enthalpy limits into the incoming material specification authorizes immediate shipment rejection upon detection of secondary melting transitions.
Degraded chains lower heat distortion limits. In automotive under-hood components and power tool housings, undetected polyethylene contamination depresses the heat deflection temperature under load (ISO 75) by up to nine degrees Celsius. Parts specified to withstand ninety degrees Celsius without creep deformation sag in service, resulting in costly warranty recalls and legal liability.
A single ten-milligram differential scanning calorimetry test costing thirty-five dollars in laboratory time prevents the processing of a sixty-thousand-dollar resin shipment that would generate half a million dollars in field liability.
| Lot Adulteration Level | Raw Pellet Savings | Cycle Time Extension | Tool Cleaning Interval | Scrap Rate Increase | Net Landed Cost Impact |
|---|---|---|---|---|---|
| 100% Virgin Prime (0% Recyclate) | $0 / ton baseline | 0.0 seconds | 50,000 shots | 0.8% baseline | $0.00 / part baseline |
| 3% Contaminated Recycled Blend | -$16 / ton | +0.4 seconds | 25,000 shots | +1.2% | +$0.04 / good part |
| 7% Contaminated Recycled Blend | -$38 / ton | +1.1 seconds | 12,000 shots | +3.4% | +$0.11 / good part |
| 15% Contaminated Recycled Blend | -$81 / ton | +2.6 seconds | 4,000 shots | +7.8% | +$0.28 / good part |
Material testing agreements establish clear liability protocols between resin brokers and component manufacturers. The purchasing specification defines three critical testing conditions: mandatory testing per ISO 11357-3, a heating ramp rate of ten Kelvin per minute, and a maximum secondary peak enthalpy ceiling of 0.5 Joules per gram across the 115 to 135 degrees Celsius range. When an incoming railcar exceeds this enthalpy threshold, the receiving laboratory flags the certificate of analysis as invalid.
The buyer issues an immediate hold notice, isolates the transfer piping, and charges all demurrage costs back to the supplying vendor. Inserting ASTM D3418 thermal curve acceptance envelopes into section four of the master purchasing agreement shifts the burden of freight and disposal costs back to the compounder upon incoming lot failure.