Cross Regional Polyolefin Landed Cost Arbitrage under Differing Feedstock Cracker Yield Economics
Calculating polyolefin landed arbitrage viability demands evaluating cracker co-product yield spreads against comonomer properties and freight tariffs.

Feedstock
Thermal Cracker Yield Dynamics and Yield Slates
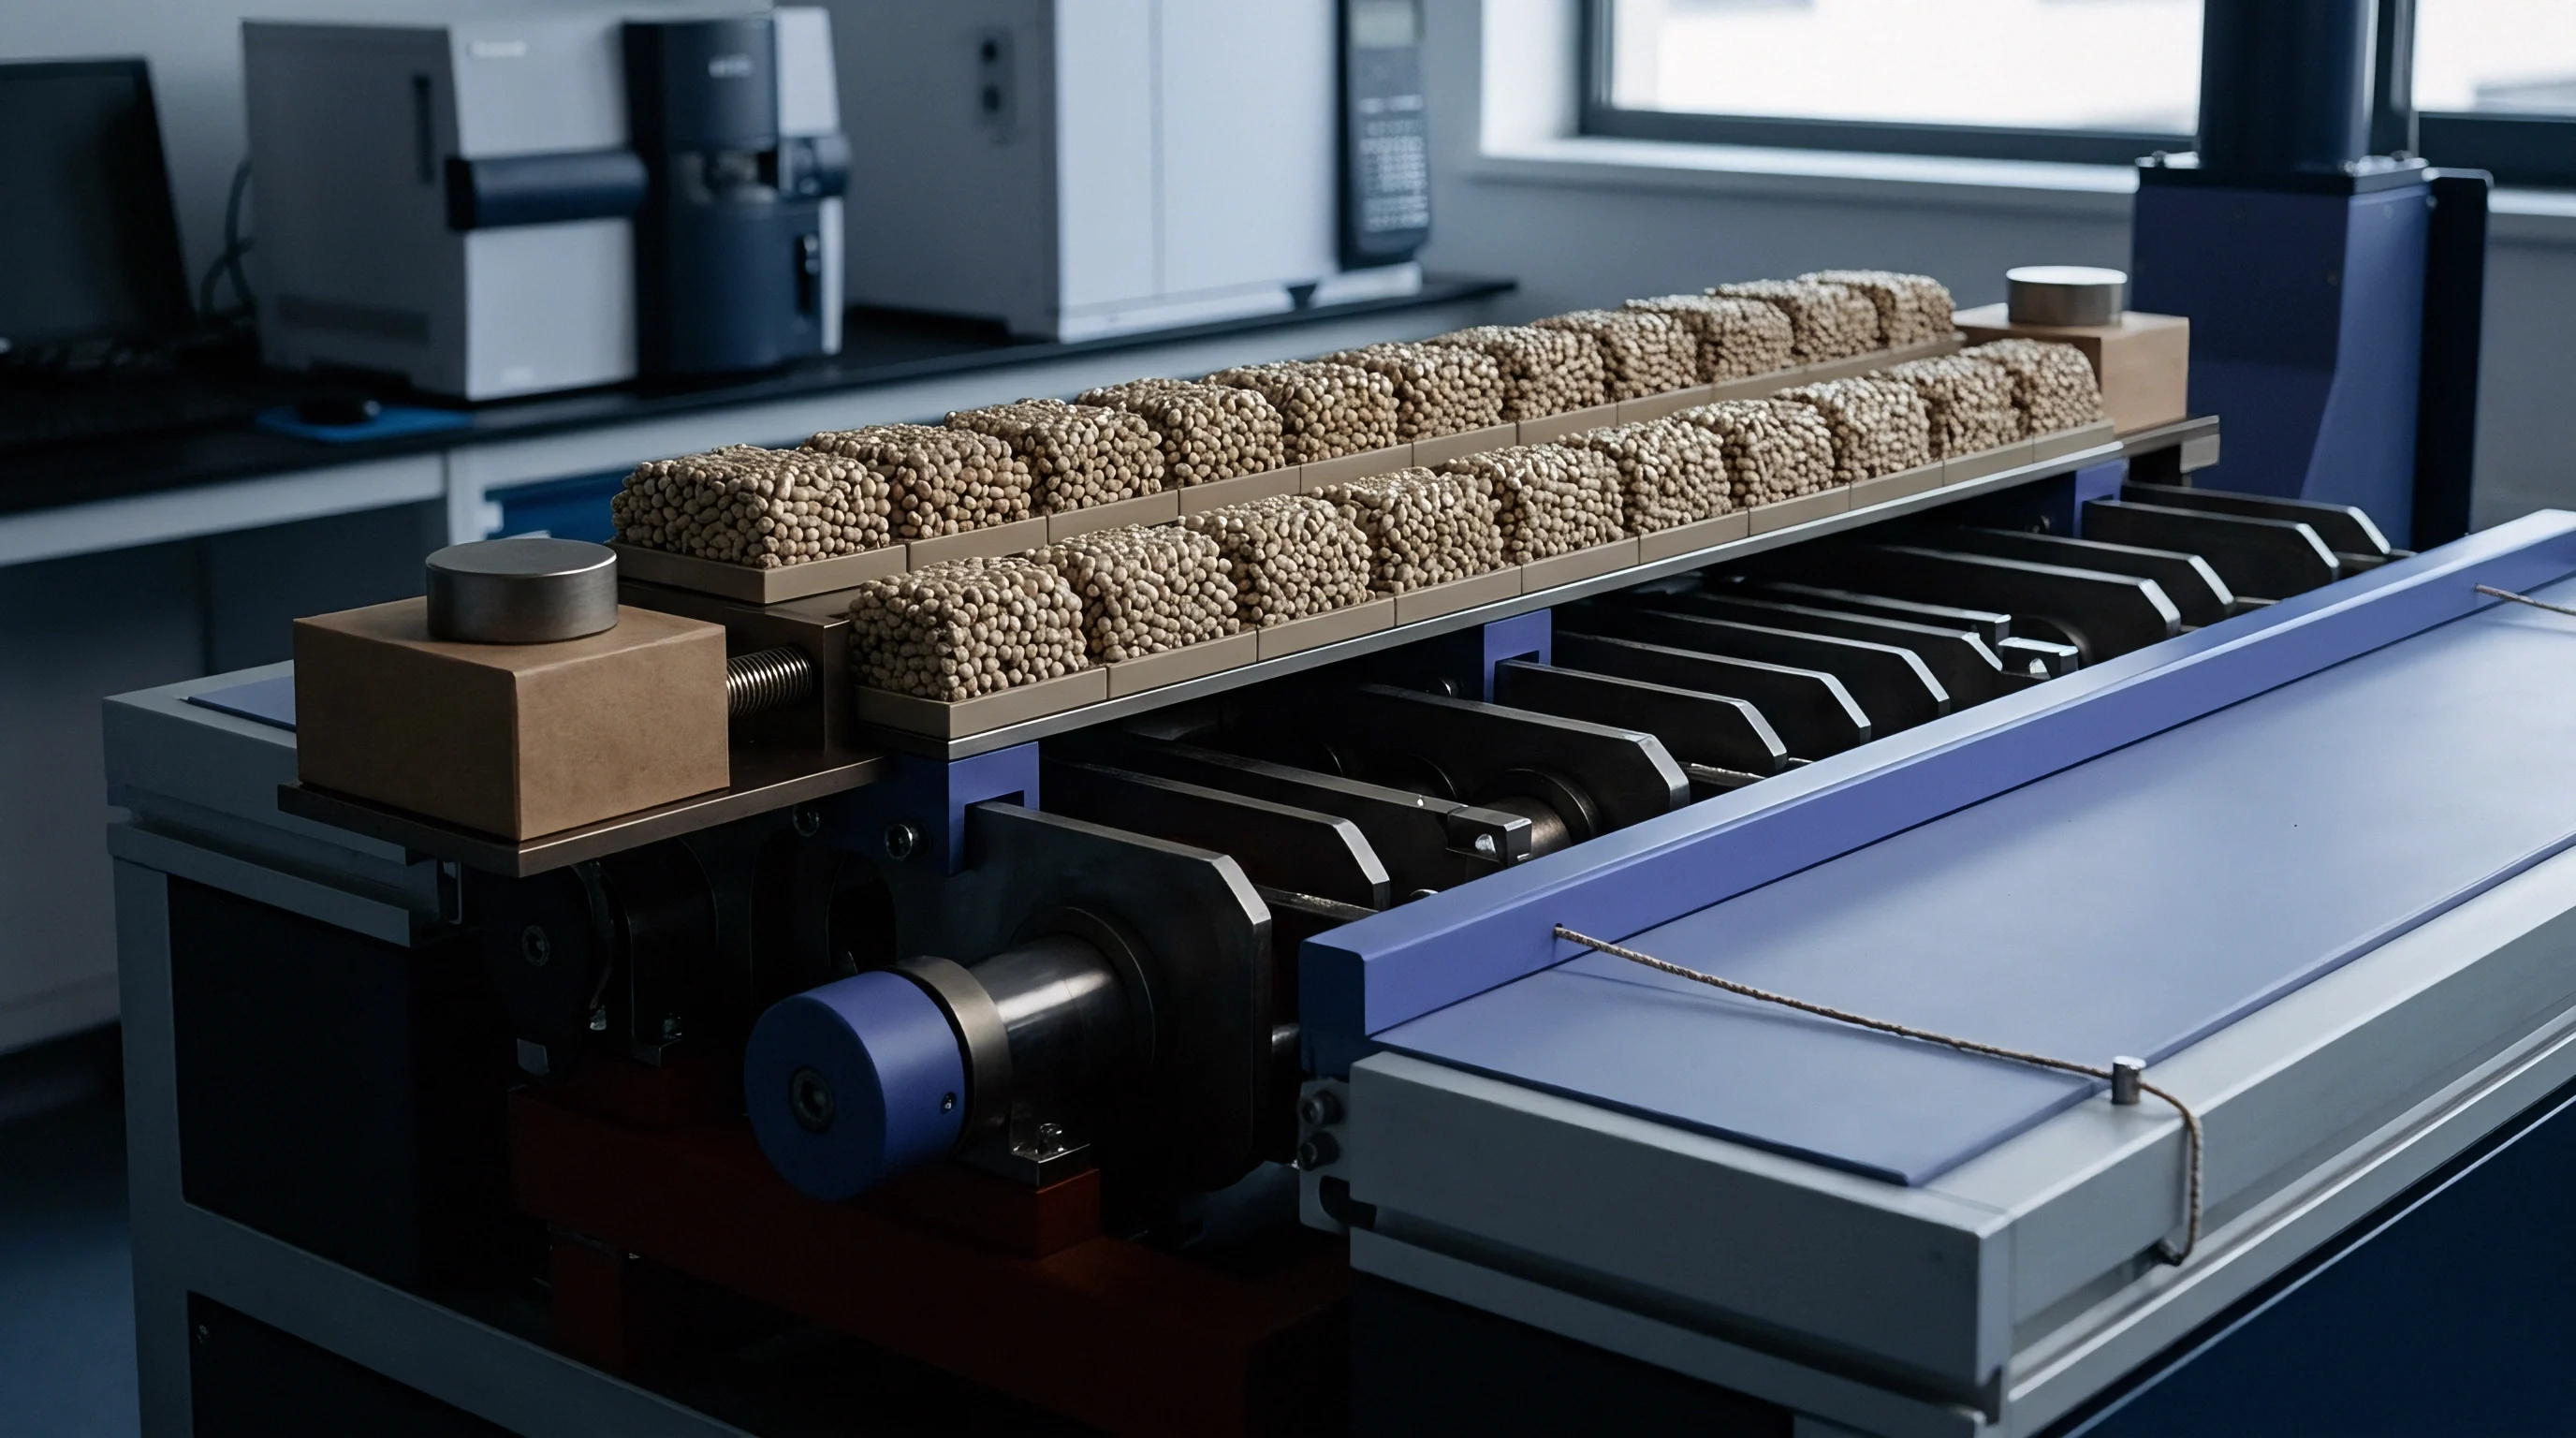
Thermal cracking of light alkanes and heavy petroleum fractions operates under thermodynamic limits that set regional cash-cost baselines for monomer production. Gas-based steam crackers rely primarily on ethane, yielding roughly 78 to 80 percent ethylene by weight at furnace temperatures of 840 to 860 degrees Celsius. Co-product yields from pure ethane are minimal ~ under 2 percent propylene, 1.5 percent butadiene, and 3 percent pygas per tonne of feed.
As a result, ethane crackers avoid complex downstream fractionation trains dedicated to heavy co-product recovery.
Cracking liquid naphtha or heavy atmospheric gasoil yields a very different output matrix. At moderate severity, naphtha crackers produce 30 to 35 percent ethylene by weight, with the rest split across high-value co-products: 14 to 16 percent propylene, 4 to 5 percent butadiene, and 18 to 22 percent pygas rich in benzene, toluene, and xylenes. The net margin of a naphtha cracker hinges on co-product pricing.
When demand drives up prices for butadiene and aromatics, co-product credits offset the cash cost of ethylene production. Conversely, weak co-product prices push the full operating burden of the furnace onto ethylene alone, widening the cost advantage held by ethane producers.
- Quantify the raw feedstock conversion efficiency per metric tonne of ethylene output based on current furnace yield slates.
- Deduct real-time spot co-product cash credits for propylene, butadiene, and pygas fractions from the gross fuel and feed bill.
- Add regional fixed operating expenses, including catalyst replacement, energy consumption, and capital amortization burdens.
- Calculate net monomer cash costs at the cracker gate prior to polymerization unit transfers.
Propane dehydrogenation units bypass steam cracker co-product balances entirely by converting dedicated propane feeds into polymer-grade propylene at mass yields exceeding 85 percent. These specialized units operate under distinct market dynamics, where the spread between liquid petroleum gas and polymer-grade monomer dictates operating economics independently of ethylene demand.
Non-compliance with import tariff origin classifications under HS Code 3901.10 exposes importers to retroactive duty adjustments and customs hold penalties.
| Feedstock Type | Ethylene Mass Yield (%) | Propylene Mass Yield (%) | Butadiene Mass Yield (%) | Pygas & Aromatics Yield (%) | Specific Energy Consumption (GJ/t Ethylene) |
|---|---|---|---|---|---|
| Ethane (Shale Gas) | 78.5 | 1.6 | 1.2 | 2.4 | 17.5 |
| Propane (LPG) | 42.0 | 16.8 | 3.1 | 6.5 | 22.0 |
| Light Naphtha | 33.5 | 15.2 | 4.5 | 19.8 | 26.0 |
| Heavy Atmospheric Gasoil | 24.0 | 14.0 | 5.0 | 23.5 | 31.5 |

Regional Monomer Cash Cost Spreads
Shale-gas development in North America and low-cost field extraction in the Middle East position gas-based polymer producers at the bottom of the global cost curve. European and Asian assets reliant on imported naphtha occupy the upper cost quartiles during periods of high crude oil prices. Ethane feedstock advantages translate directly into low-cost polyethylene pellets entering international trade channels.
Failing to track regional co-product credit fluctuations misprices long-term resin import contracts when crude oil drops below alkane parity values.

Comonomer

Polymer Architecture and Catalytic Differences
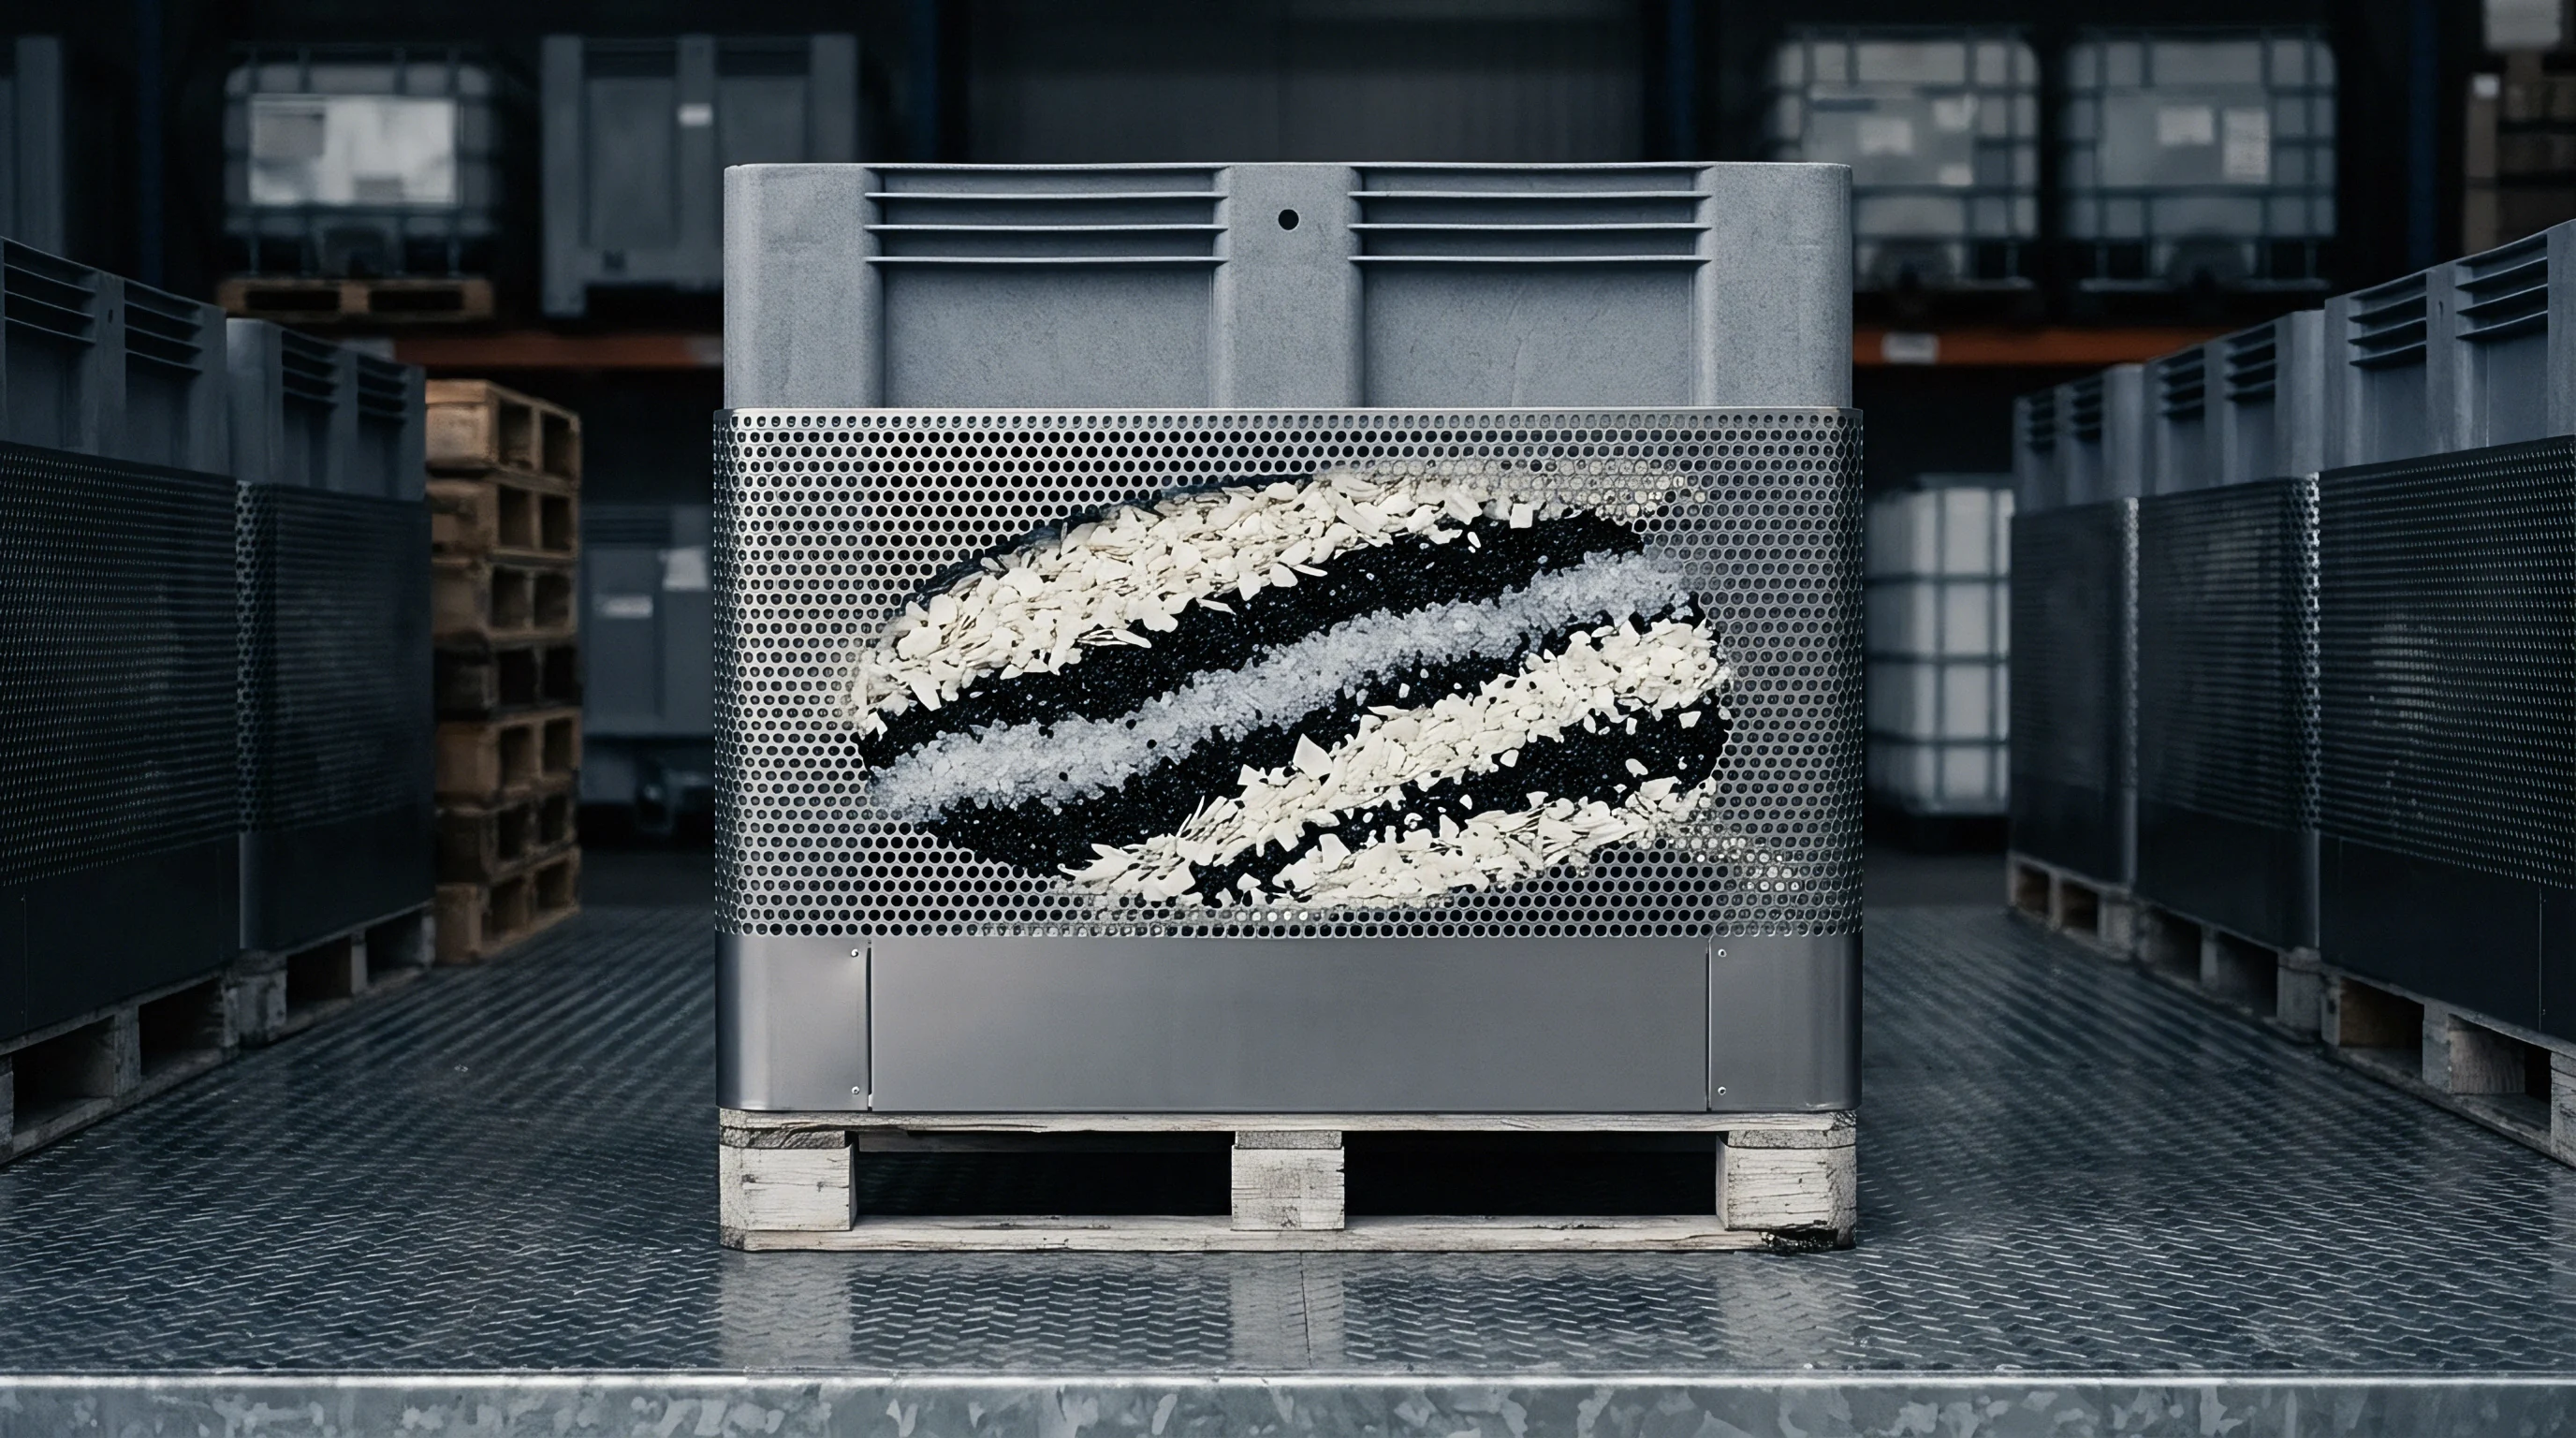
Alpha-olefin selection during linear low-density polyethylene production determines long-term mechanical strength, environmental stress crack resistance, and optical clarity. North American ethane-based polyolefin complexes typically integrate localized ethylene-derived comonomer units producing butene-1 or hexene-1. European naphtha-integrated complexes frequently incorporate hexene-1 or solution-grade octene-1 comonomers to serve high-tier packaging applications.
Substituting a butene-based linear low-density grade for an octene-based structural film resin introduces structural performance deficits. Butene-1 incorporates short ethyl branches along the backbone, whereas hexene and octene-1 introduce longer branches that increase tie-molecule density within the amorphous regions between crystalline lamellae. Lower tie-molecule density reduces slow crack growth resistance, causing failure under sustained mechanical stress.
Comonomer branch length dictates tie-molecule network density independently of final resin density values.
- Comonomer Shortage Deficits reduce Dart Drop impact performance under ASTM D1709 Method A when replacing C8 resins with C4 variants.
- High Oligomer Fractions cause severe die buildup and smoke generation during high-speed blown film extrusion processing.
- Broad Molecular Weight Distribution lowers melt strength, causing bubble instability on high-blow-up-ratio production lines.
- Unreacted Catalyst Residues accelerate thermal-oxidative degradation during melt processing, reducing yellowing index stability under ISO 11357 standards.
Catalyst selection further governs molecular weight distribution and short-chain branching distribution. Ziegler-Natta catalyst systems yield broad polydispersity profiles with uneven comonomer incorporation, concentrating alpha-olefins in the low molecular weight fraction. Metallocene and single-site catalysts yield narrow molecular weight distributions with uniform short-chain branching distribution across all chain lengths, maximizing mechanical toughness per unit density.
| Property Parameter | Test Standard | Test Condition | US Ethane C6-LLDPE | EU Naphtha C8-LLDPE |
|---|---|---|---|---|
| Melt Flow Rate (MFR) | ISO 1133 / ASTM D1238 | 190 °C / 2.16 kg | 1.0 g/10 min | 0.9 g/10 min |
| High Load Melt Index (HLMI) | ISO 1133 / ASTM D1238 | 190 °C / 21.6 kg | 28.5 g/10 min | 22.0 g/10 min |
| Polydispersity Index (Mw/Mn) | Gel Permeation Chromatography | 135 °C in TCB | 3.6 | 2.4 |
| Density | ISO 1183-1 | 23 °C | 0.918 g/cm³ | 0.920 g/cm³ |
| Dart Drop Impact Strength | ASTM D1709 | Method A, 38 µm film | 320 g | 650 g |
| ESCR (Condition B, 10% Igepal) | ASTM D1693 | 50 °C, F50 hours | 450 h | > 1000 h |

Processing Behavior and Rheological Variance
Shear sensitivity varies sharply between broad and narrow polydispersity resins during melt processing. Broad molecular weight distribution resins exhibit pronounced shear thinning, reducing entrance pressures inside injection molds and extrusion dies. Narrow-distribution metallocene resins require higher processing torque and generate elevated melt temperatures at identical screw speeds, while catalyst residues can degrade melt strength.
A narrow molecular weight distribution resin requires higher extrudate temperature to match the die swell behavior of a broad distribution grade.
Freight

Logistics Modes and Containerized Transport Mechanics
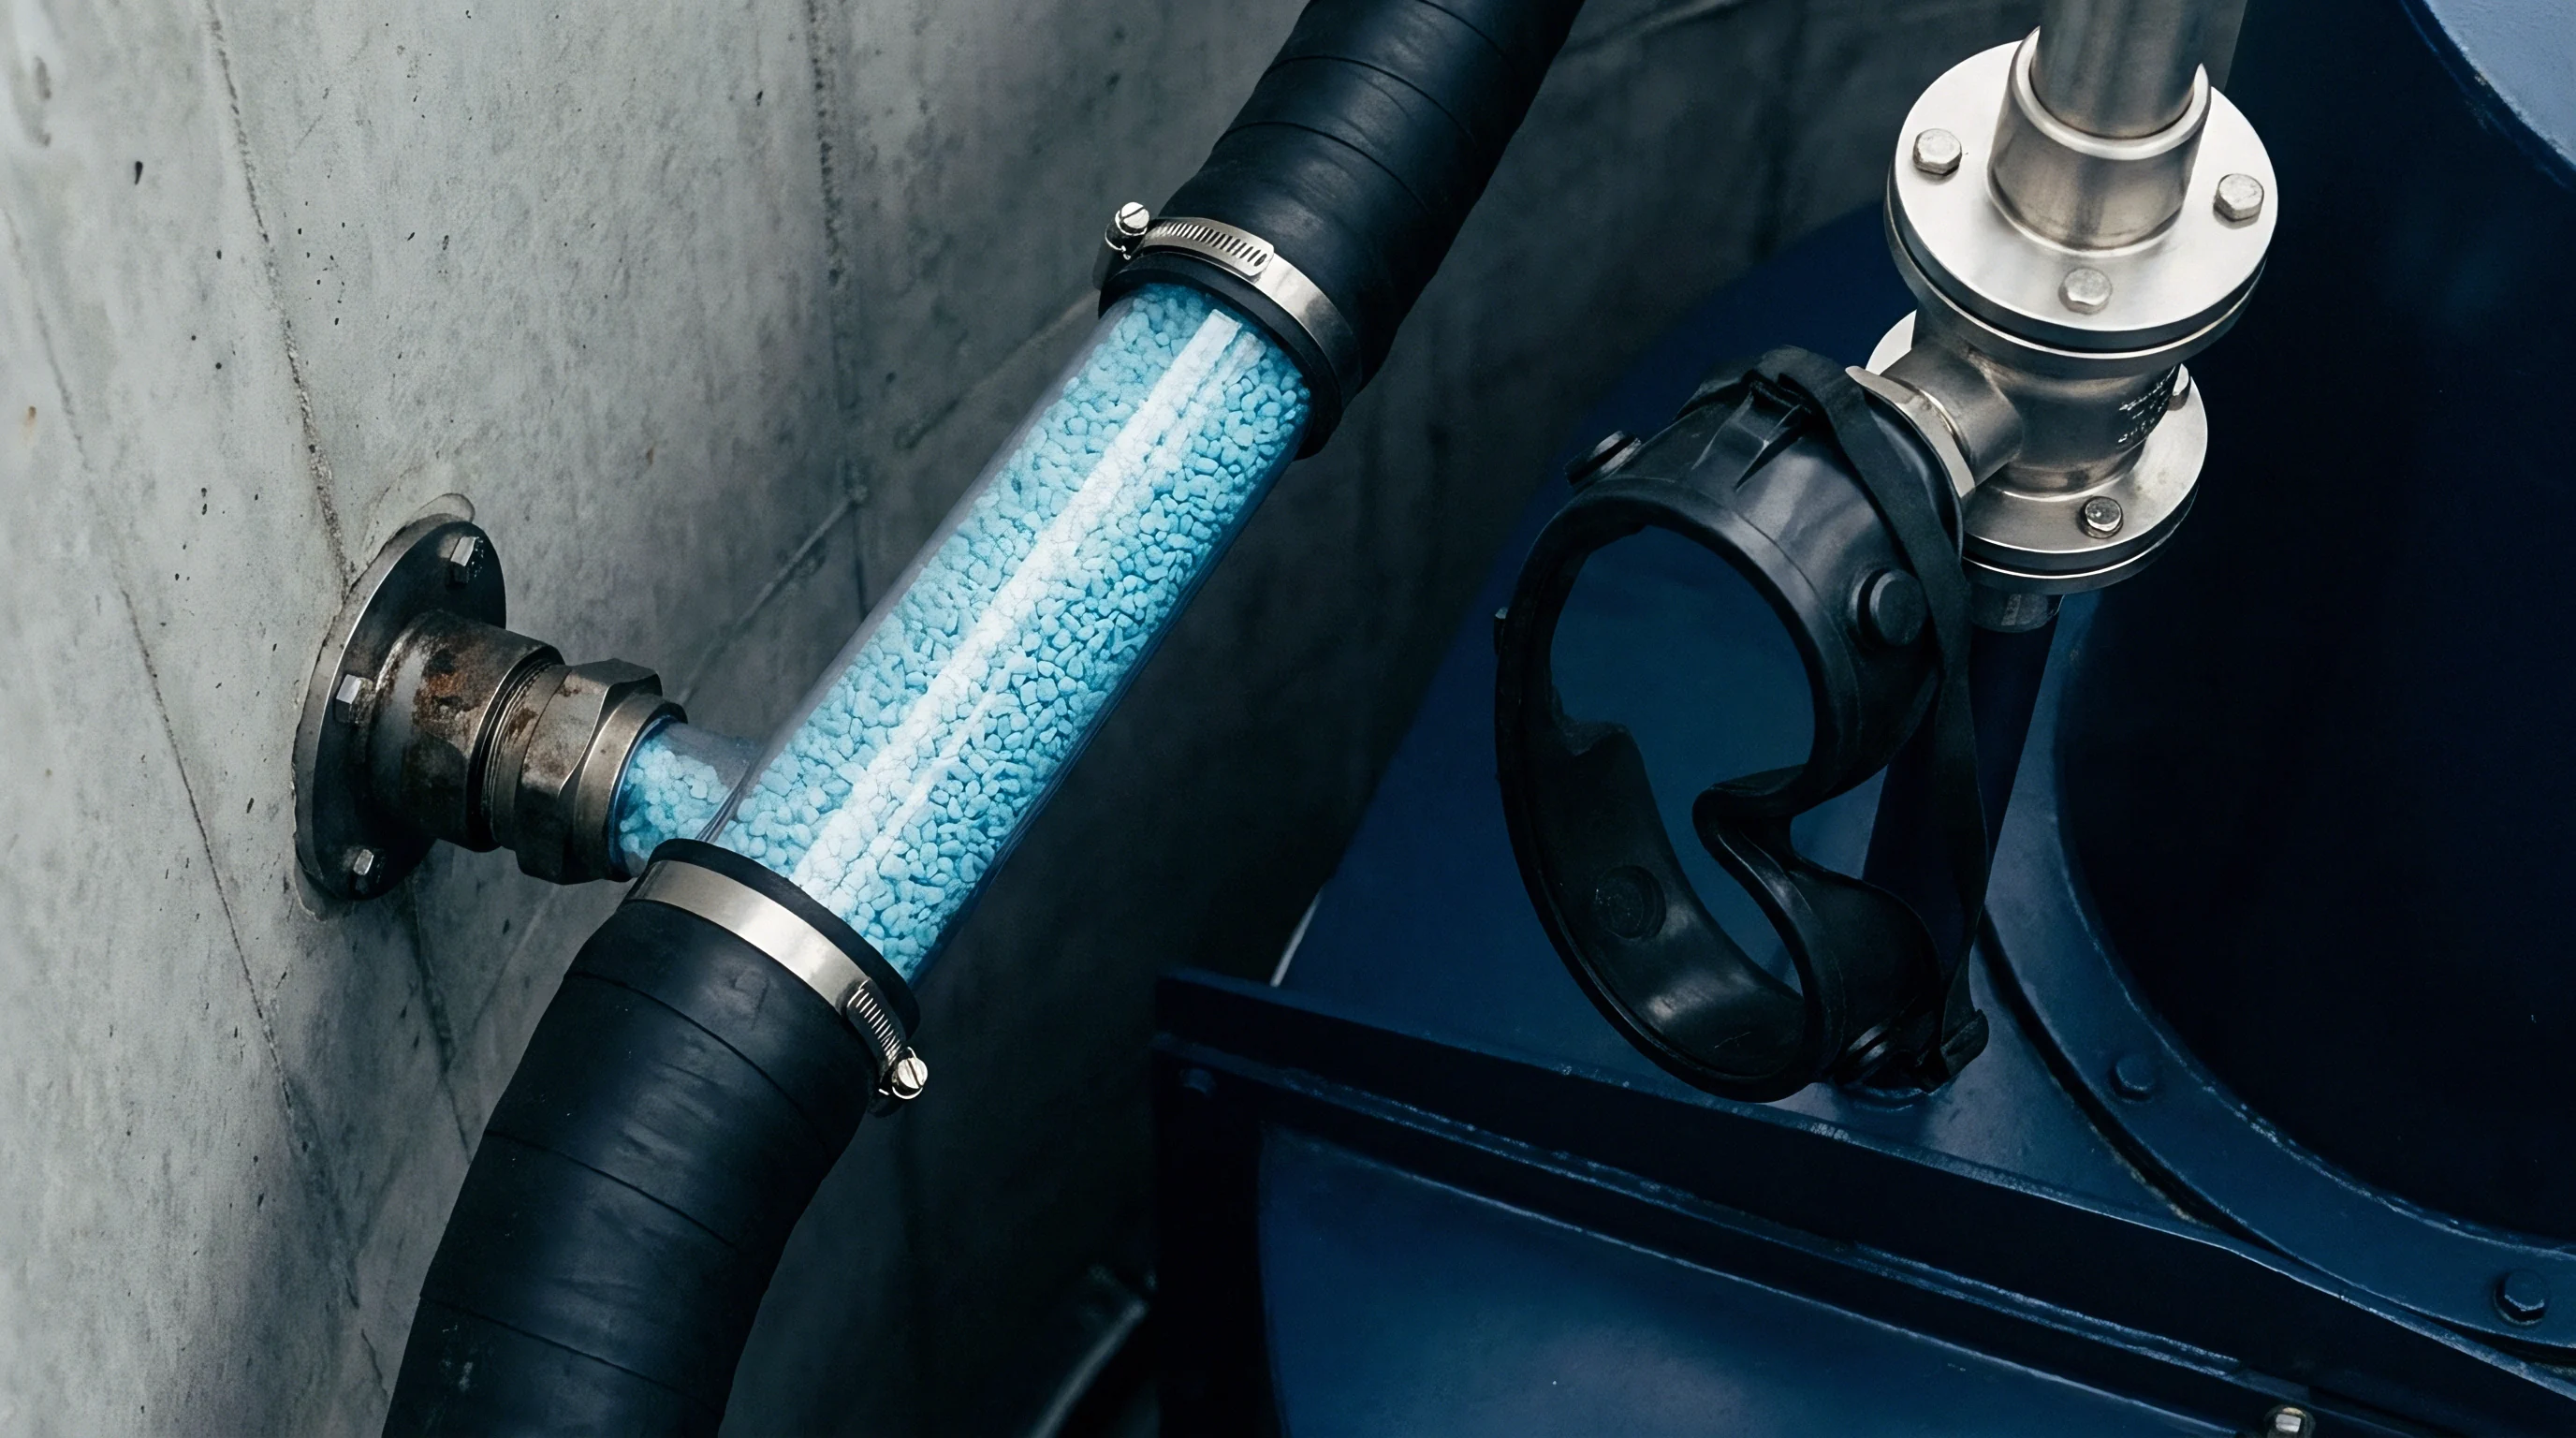
Ocean freight movement of bulk polyolefin resins utilizes either sea-bulk container liners or packaged 25-kilogram bags stacked on pallets inside standard 40-foot dry bulk containers. Sea-bulk liners accommodate up to 24 metric tonnes of loose resin pellets loaded pneumatically through top ports. Packaged container loads carry a maximum payload of 24.5 metric tonnes on pallets, incurring labor and packaging material costs prior to port dispatch.
Destination handling of bulk sea-bulk containers requires specialized pneumatic discharge infrastructure or tilting chassis platforms. Unloading unpackaged pellets directly into silorails or plant storage silos avoids bagging fees at origin but demands stringent cleanout protocols between shipments to prevent cross-contamination.
Ocean container freight rates fluctuate by over twelve hundred dollars per forty-foot container within single quarter logistics contracts.

Why Do Ocean Freight Surges Invalidate Published Spreads?
Landed arbitrage calculation depends on freight stability over sixty-day transit windows. Rapid freight spikes erode the margin calculated at origin loading port exit, while standard international trade terms dictate delivery risks and import duty obligations across borders.
Importers utilizing Cost, Insurance, and Freight (CIF) terms remain exposed to destination terminal handling fees, demurrage charges, and customs clearance delays governed by standard Incoterms clauses.


Qualification

Incoming Resin Lot Inspection and Quality Protocols
Receiving imported resin lots requires rigorous verification protocols to ensure material compliance before discharge into central production silos. Bulk container shipments carry risks of contamination, moisture ingress, and thermal-oxidative degradation during prolonged ocean transit, particularly when storage silos retain heat. Sampling protocols must capture representative specimens across top, middle, and bottom discharge layers.
Melt Flow Rate verification under ISO 1133 at 190 degrees Celsius with a 2.16-kilogram load confirms basic grade consistency. Differential Scanning Calorimetry tests per ISO 11357-3 identify contamination from secondary polymer species through distinct endothermic melting peaks, while moisture measurement via Karl Fischer titration prevents severe splay and processing defects in hydrolytically sensitive additives or compounds.
Thermal history analysis via Differential Scanning Calorimetry reveals secondary polymer contamination down to zero point five percent by weight.
- Seal Verification confirms intact container door locks and records security serial numbers against original bill of lading documentation.
- Pellet Dust Screening quantifies fines content below 500 microns using micro-sieving per ASTM D7486 standards to prevent hopper clogging.
- Oxidative Induction Time Analysis determines antioxidant depletion levels under pure oxygen at 200 degrees Celsius per ISO 11357-6 protocols.
- Density Measurement via gradient column per ISO 1183 verifies comonomer incorporation consistency across incoming production batches.
Pellet fines generated by high-velocity pneumatic conveyance create melt pump pressure fluctuations and unmelts during processing.
Melt flow index variances between testing sites frequently stem from differences in instrument calibration.


Arbitrage

Landed Cost Model and Economic Viability
True economic arbitrage compares the fully landed cost per good produced part against domestic resin sourcing options. The baseline equation incorporates free-on-board pellet price, ocean transport, marine insurance, customs tariffs, port handling fees, inland freight, and compounding adjustment expenses.
Physical part manufacturing introduces financial penalties when processing lower-cost imported grades. Poorer dimensional stability or elevated scrap rates from broader melt index spreads reduce realized part yield per metric tonne of resin. A two percent increase in molding scrap completely negates a fifty-dollar-per-tonne price advantage at origin.
| Cost Component Elements | Base Baseline Option | Freight Spike Scenario | High-Duty Tariff Scenario |
|---|---|---|---|
| US Gulf Coast FOB Export Price | € 880 | € 880 | € 880 |
| Ocean Freight & Fuel Surcharge (24t load) | € 95 | € 185 | € 95 |
| Marine Insurance (0.3% CIF Value) | € 3 | € 3 | € 3 |
| EU Common Customs Duty (6.5% Tariff) | € 64 | € 70 | € 125 |
| Port Handling & Terminal Discharge (THC) | € 35 | € 35 | € 35 |
| Inland Truck Freight to Silo Destination | € 45 | € 45 | € 45 |
| Quality Verification & Sampling Expense | € 12 | € 12 | € 12 |
| Total Landed Resin Cost | € 1,134 | € 1,230 | € 1,195 |
| Spot Domestic European Resin Price | € 1,240 | € 1,240 | € 1,240 |
| Net Landed Arbitrage Margin | + € 106 | + € 10 | + € 45 |

Risk Boundaries and Execution Decisions
Import decisions hinge on maintaining a minimum net landed cost buffer of eight to ten percent over domestic spot pricing. This margin absorbs currency exchange fluctuations, port storage penalties, and potential processing scrap adjustments. When shipping delays extend working capital cycles, inventory holding costs further diminish the calculated margin advantage.
Evaluating working capital carrying costs over a sixty-day supply pipeline determines whether paper arbitrage gains yield positive financial returns on the factory floor.