Quantifying Transverse Matrix Contraction and Volumetric Shrinkage in Precision Moulded Polyamide Components
Transverse matrix contraction in glass filled polyamides exceeds flow direction shrinkage by up to three to one requiring asymmetric mold steel allowances.

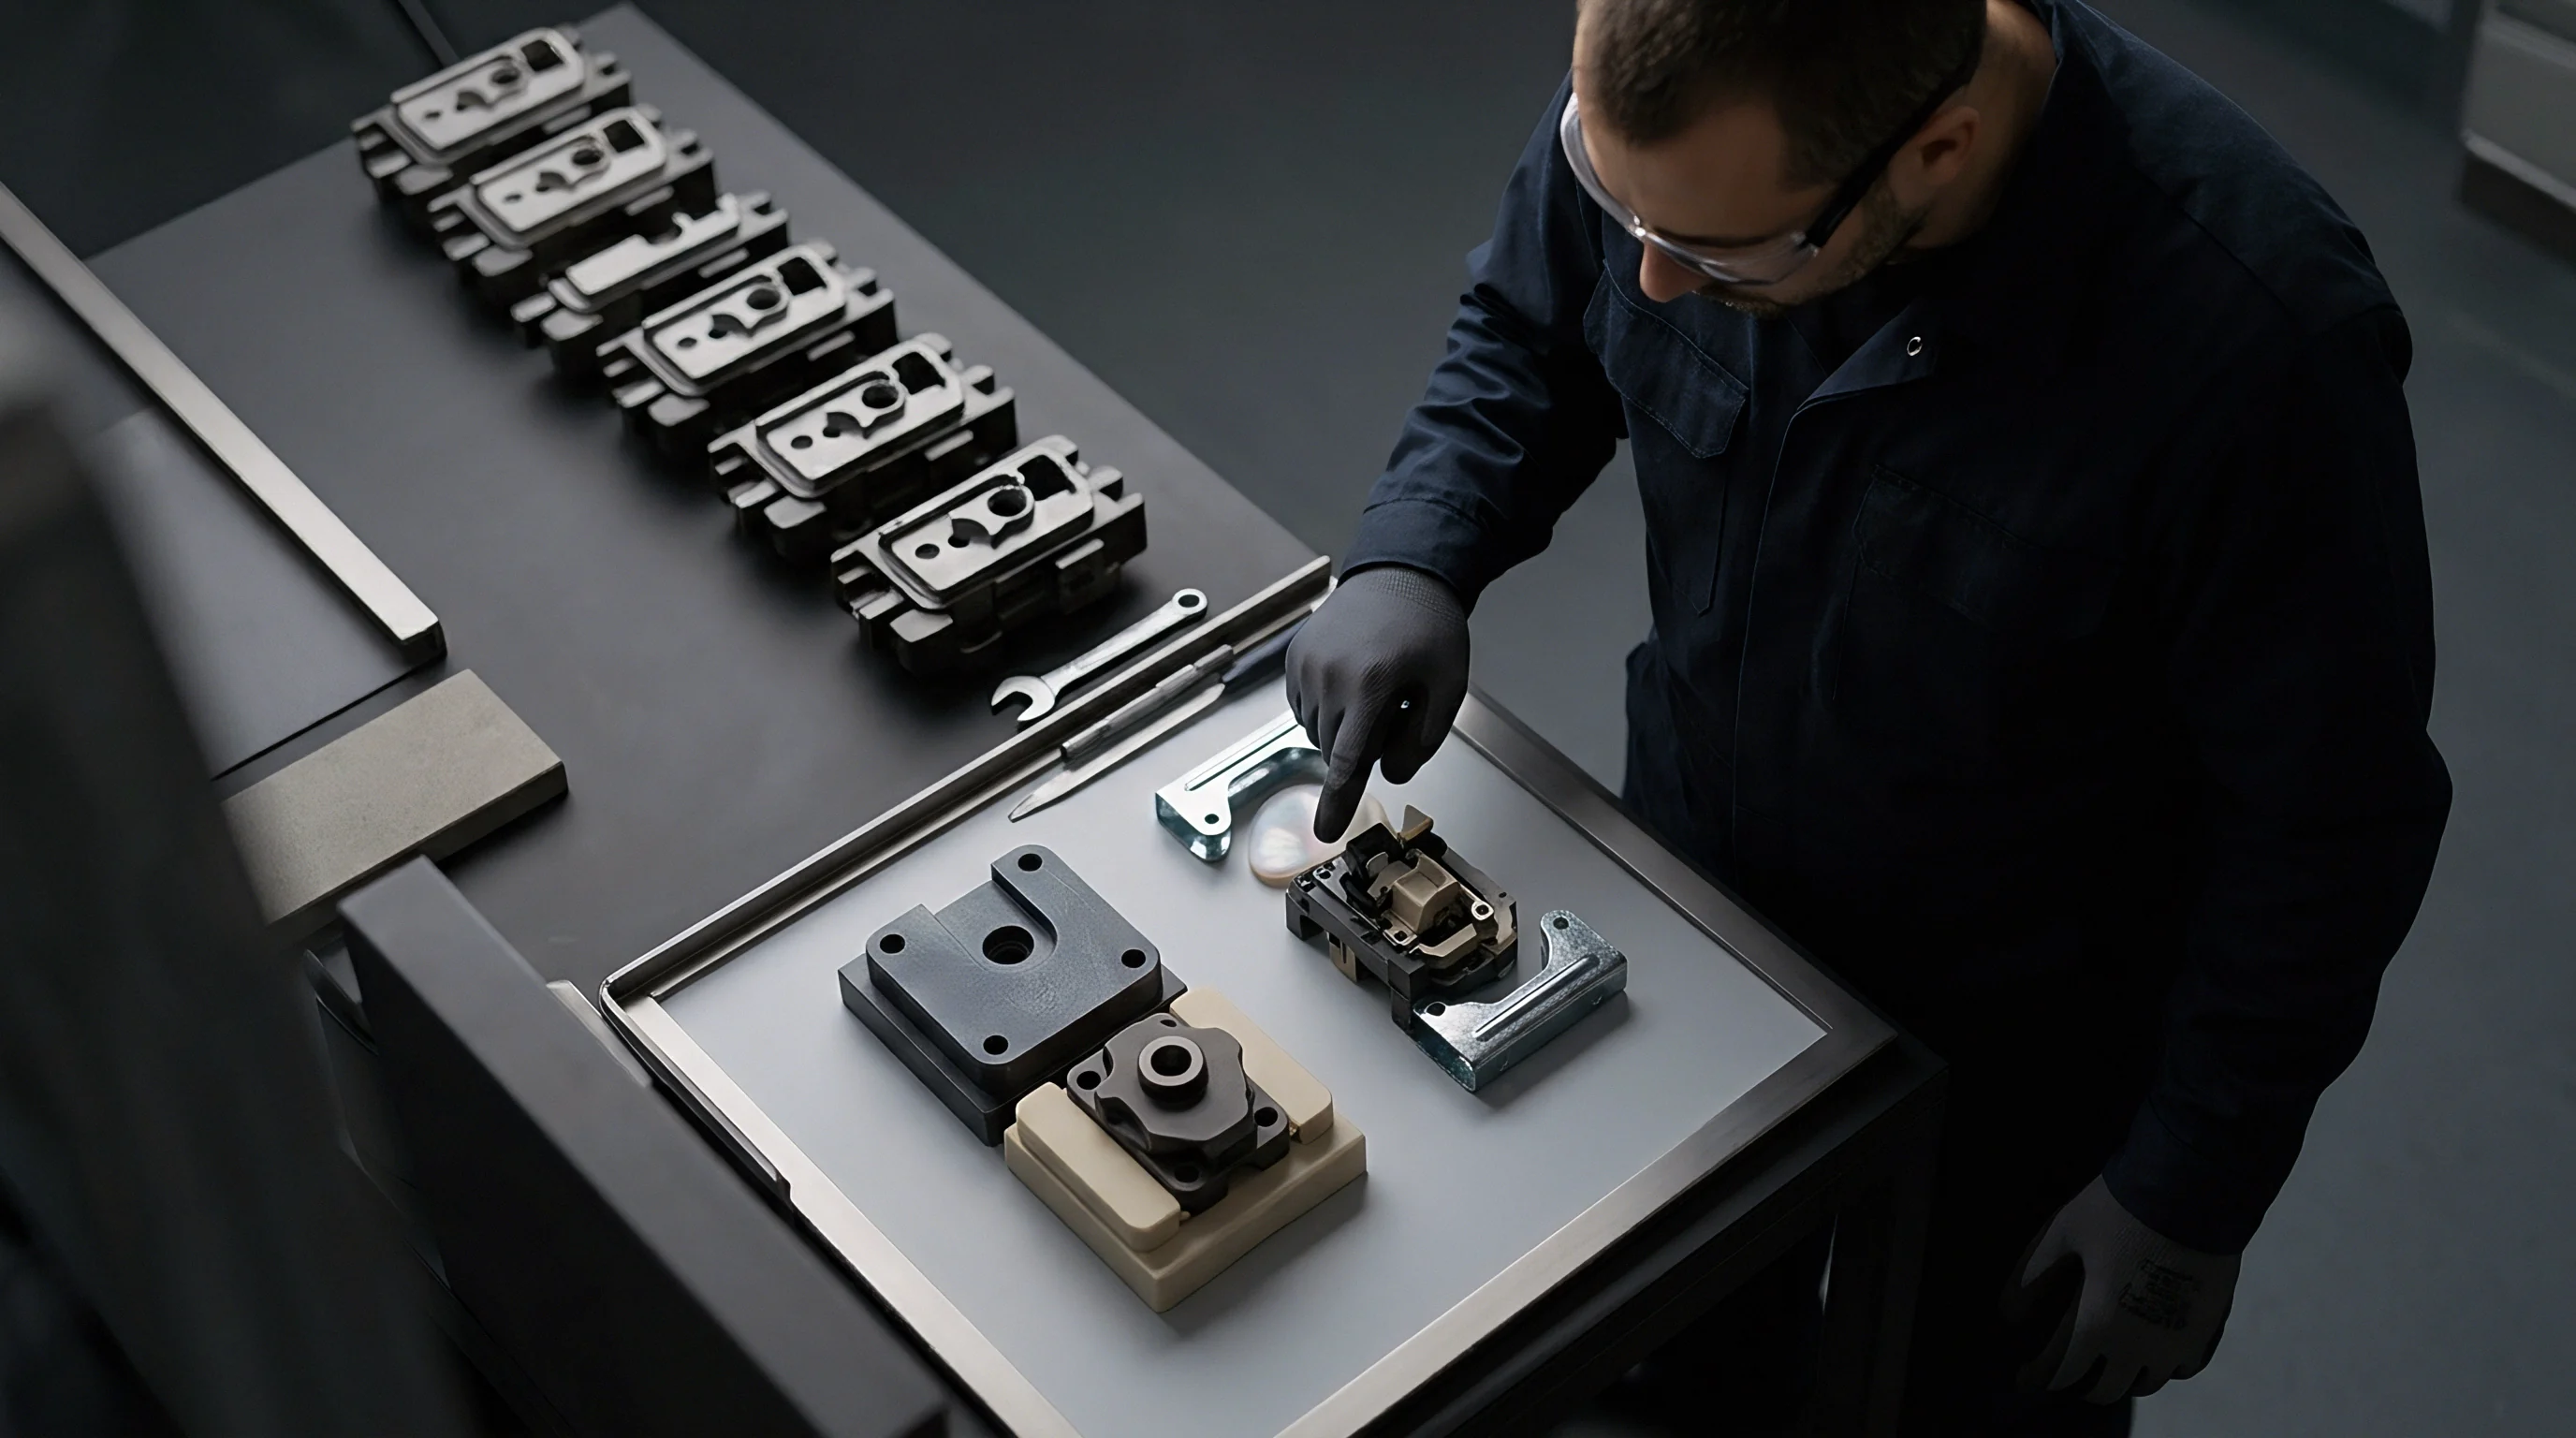
Anisotropy
Glass fiber reinforcement in semicrystalline polymers creates directional variance in dimensional contraction between the mold cavity and the ambient part. Matrix molecules realign during flow, while embedded rigid fibers resist contraction strictly along their longitudinal axes. Short strands align with stream lines.

Differential Flow Alignment and Fiber Aspect Ratios
Short strands rotate along shear gradients during cavity filling, establishing localized orientation vectors. In glass-reinforced polyamide 66 containing thirty percent fill by weight, fibers align primarily parallel to the melt stream in high-shear skin layers. The central core layer retains a transverse or randomized fiber orientation due to lower shear stress and extensional flow patterns near the advancing melt front.
This structural stratification causes profound mechanical and dimensional asymmetry. Molded components contract significantly less along the fiber alignment vector than across it. Matrix contraction perpendicular to flow remains dominated by the unreinforced polymer chain relaxation, exhibiting shrinkage rates three to four times higher than the parallel direction.
Calculating tooling geometry requires mapping these orientation vectors across complex rib intersections and wall transitions.
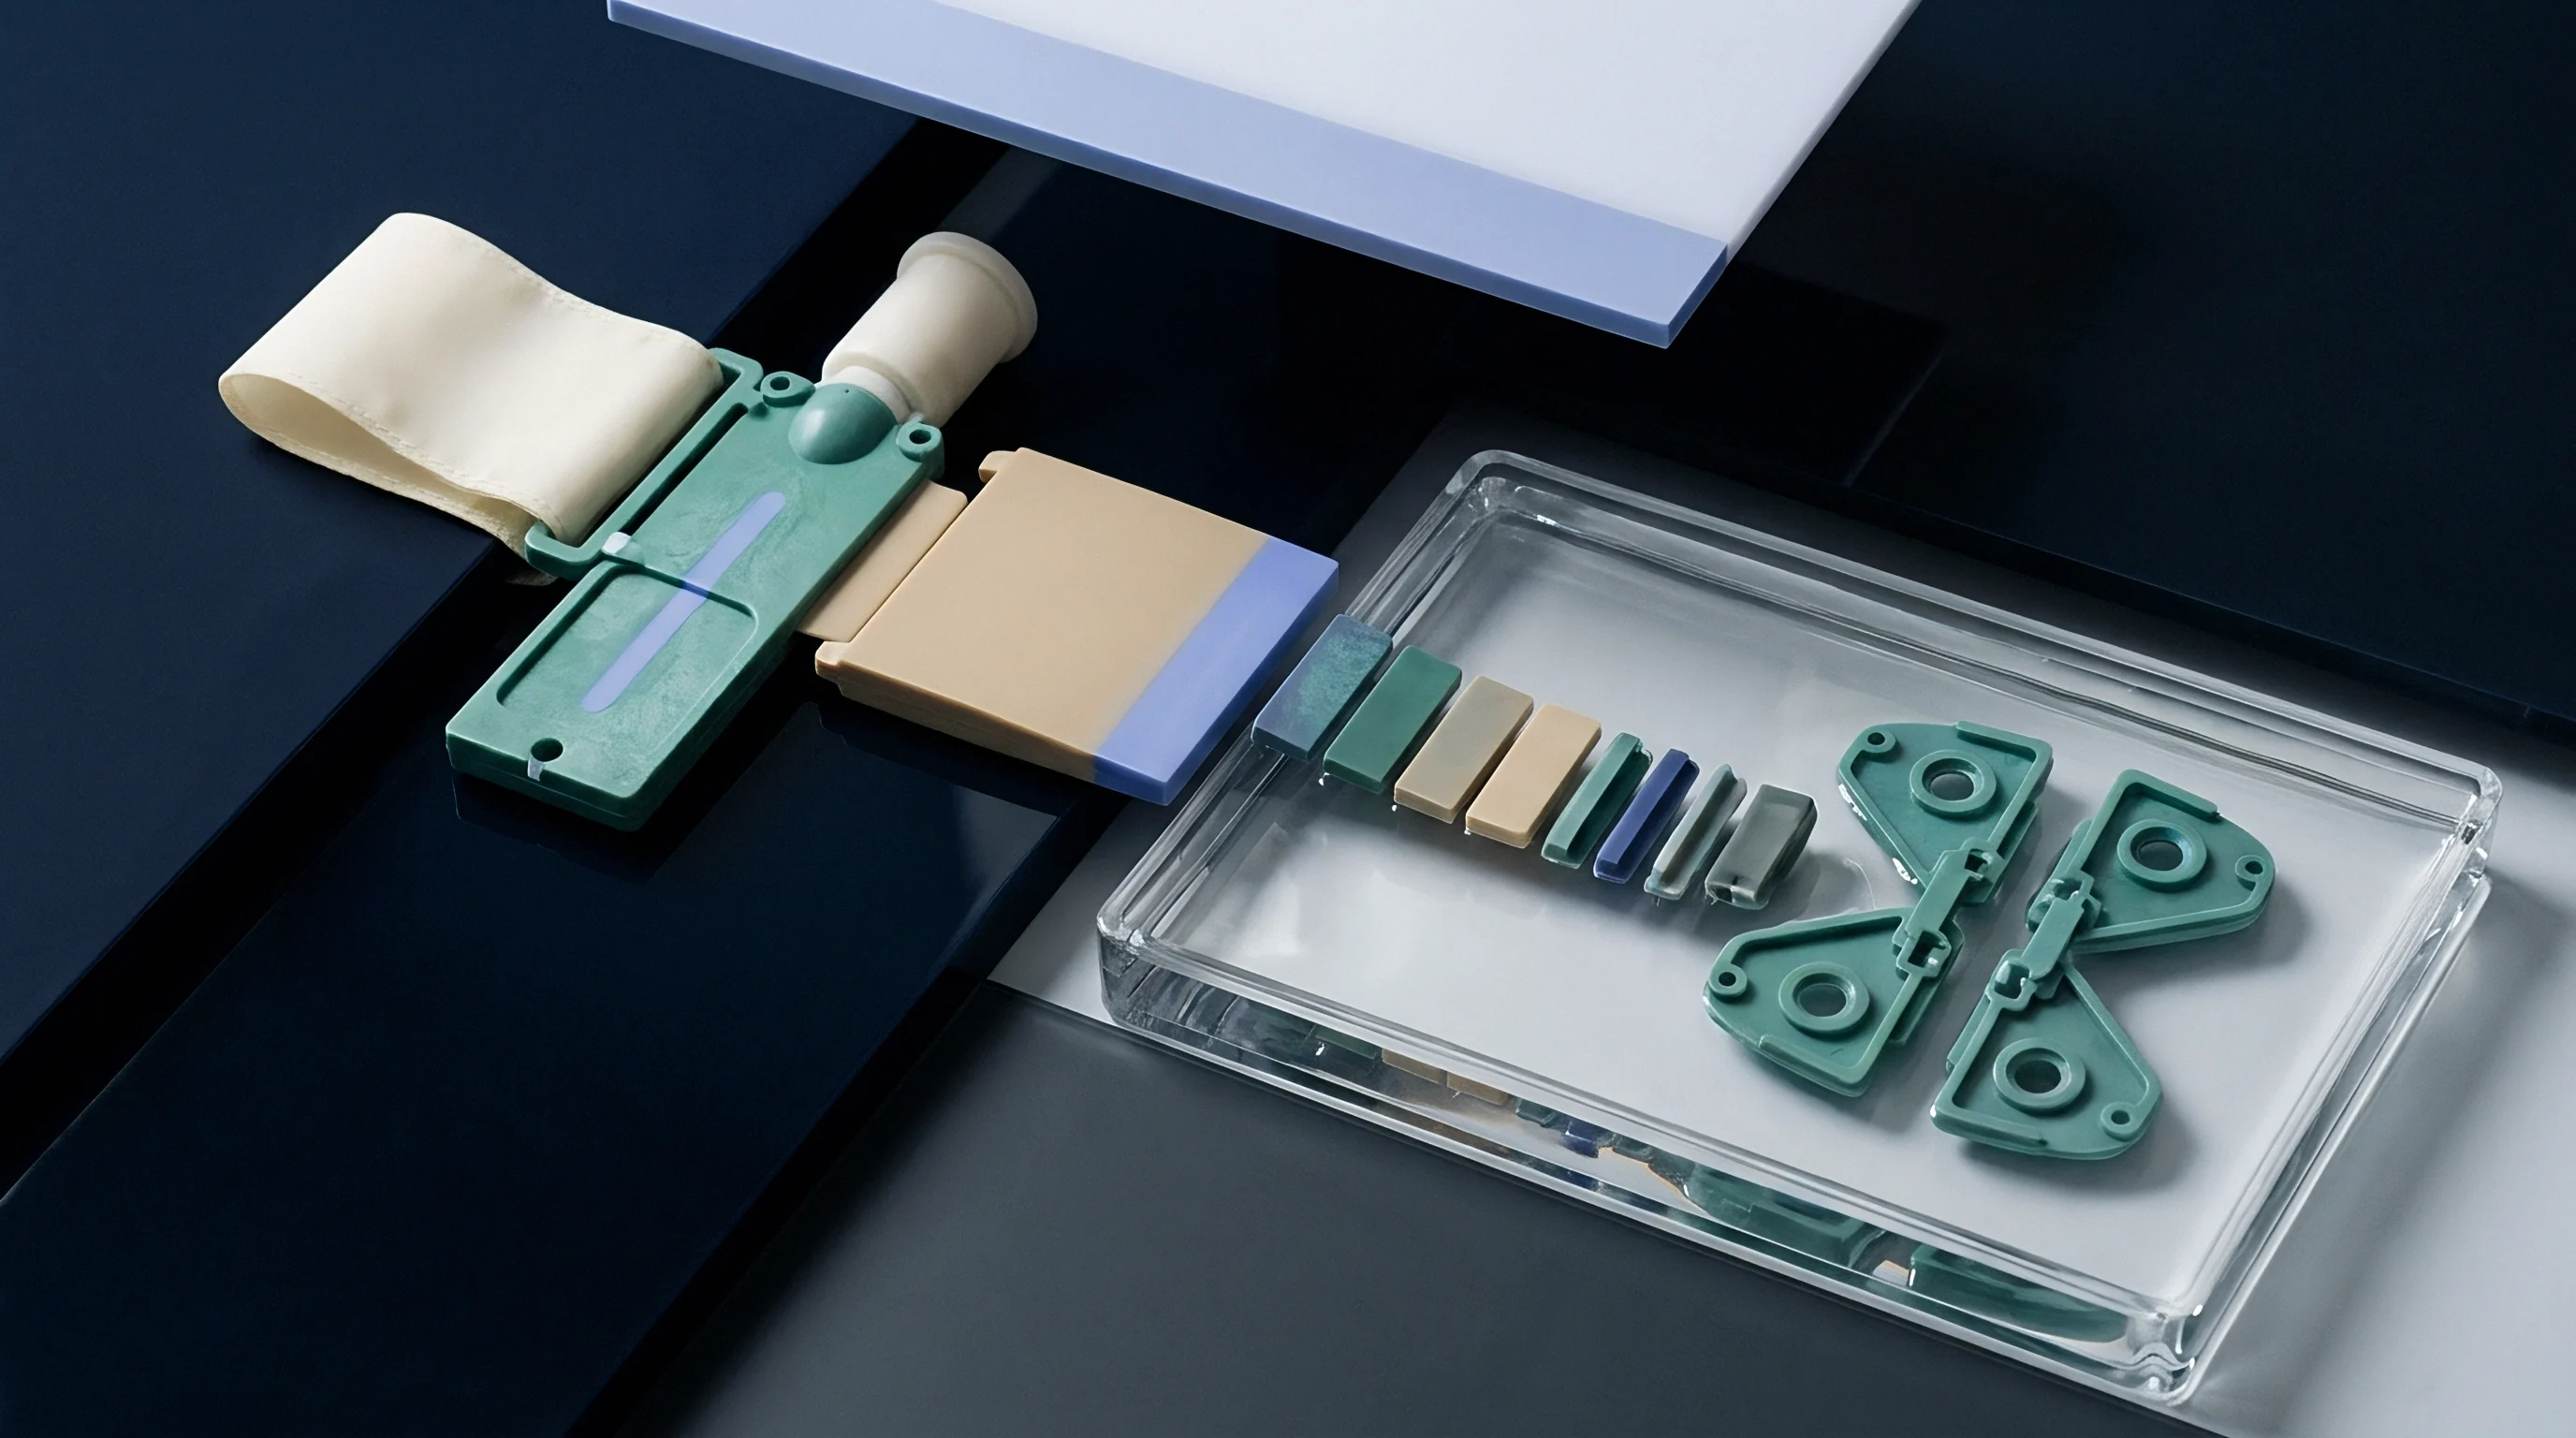
Shear Layering across Wall Sections
Velocity profiles across a three millimeter wall thickness generate three distinct structural zones from skin to core. High shear stress adjacent to the cold steel surface forms a frozen skin where fibers orient tightly along the main flow direction. Mid-wall transition zones experience intermediate shear, while the central core maintains high thermal energy longer, allowing polymer chains to relax into isotropic distributions before freezing.
Wall thickness dictates freeze time. Thicker cross-sections prolong the liquid core duration, increasing the volumetric fraction of randomly oriented fibers. Consequently, nominal transverse contraction increases in heavy wall sections.
Tooling designers who apply uniform shrinkage factors across varying wall thicknesses invite severe part warpage, bow, and internal stress concentrations.

Matrix Contraction Ratios in Glass Filled Polyamides
Unfilled resin shrinks isotropically near two percent, whereas thirty percent fiber loading reduces parallel shrinkage below zero point three percent. Transverse shrinkage in the same thirty percent reinforced compound typically ranges between zero point seven and1 point one percent depending on processing conditions and matrix crystallinity.
| Grade Family | Glass Content % | Parallel Shrinkage % | Transverse Shrinkage % | Anisotropy Ratio |
|---|---|---|---|---|
| PA66 Standard | 0 | 1.20 – 1.80 | 1.30 – 1.90 | 1.08:1 |
| PA66 GF15 | 15 | 0.45 – 0.75 | 0.90 – 1.30 | 1.82:1 |
| PA66 GF30 | 30 | 0.20 – 0.45 | 0.70 – 1.10 | 2.88:1 |
| PA66 GF50 | 50 | 0.10 – 0.25 | 0.50 – 0.85 | 3.88:1 |
| PA6 Unfilled | 0 | 1.10 – 1.60 | 1.20 – 1.70 | 1.07:1 |
| PPA GF40 | 40 | 0.15 – 0.30 | 0.55 – 0.85 | 3.23:1 |
The ratio between transverse and parallel contraction widens as fiber concentration increases. At fifty percent glass content, parallel shrinkage drops to near zero, while transverse shrinkage stays above zero point five percent. This expansion of the anisotropy ratio amplifies internal shear stresses at corners and wall intersections, driving dimensional distortion after part ejection.
Transverse matrix shrinkage in PA66-GF30 reaches 0.90 percent under a 280 degree Celsius melt temperature and 80 degree Celsius mold surface wall condition.
Moulders frequently attribute out-of-spec transverse dimensions to batch raw material variation when cavity steel was cut to isotropic shrinkage assumptions.


Pack
Pressure application during the secondary injection phase forces supplementary melt into the cooling cavity to compensate for thermal density changes. Solidification causes polymer molecules to draw closer together, shrinking the total mass. Continuous melt delivery during the packing phase offsets this volume loss until gate freeze occurs.
Hydraulic Holding Pressures and Gate Freeze Dynamics
Sustaining fluid transfer until the entry aperture reaches thermal solidification prevents backflow and controls volumetric reduction. Higher packing pressure increases core density, suppressing volumetric shrinkage across both transverse and longitudinal axes. Gate freezing terminates cavity packing.
Once the gate solidifies, thermal shrinkage proceeds uncompensated. Pressure losses reduce core density. Gate geometry, melt temperature, and mold temperature dictate the exact moment of gate seal.
Small pin gates freeze rapidly, leaving thick core sections under-packed and subject to elevated transverse contraction and sink marks.
- Holding pressure level directly compresses the melt, reducing specific volume loss in core zones before gate freeze occurs.
- Melt temperature selection dictates the total thermal delta between injection and ejection, shifting crystallization kinetics.
- Tool wall temperature influences skin layer growth rates and controls the time window available for core packing.
- Gate cross sectional area governs the freeze timeline, where smaller gates solidify prematurely and truncate packing effectiveness.

Calculating Volumetric Contraction from PVT Diagrams
Specific volume changes across crystallization temperatures define the total spatial mass deficit inside the cavity. Pressure-volume-temperature behavior governs this thermodynamic path. At processing pressures of 800 bar, the specific volume of PA66-GF30 decreases along an isobaric cooling curve, yielding a predictable volumetric contraction factor.
Consider a flat plate moulding with nominal finished targets of 100.00 mm length parallel to flow, 50.00 mm width transverse to flow, and 3.00 mm wall thickness. Mold cavity dimensions must incorporate asymmetric compensation factors. Assume parallel shrinkage of zero point three percent, transverse shrinkage of zero point nine percent, and thickness shrinkage of one point zero percent under standard 80 MPa pack pressure.
Target part dimensions require explicit mold tool geometry calculation:
Cavity length parallel to flow equals 100.00 divided by (1 minus 0.003), yielding 100.301 mm.
Cavity width transverse to flow equals 50.00 divided by (1 minus 0.009), yielding 50.454 mm.
Cavity depth for wall thickness equals 3.00 divided by (1 minus 0.010), yielding 3.030 mm.
The resulting cavity volume calculates to 100.301 mm multiplied by 50.454 mm multiplied by 3.030 mm, totaling 15,333.68 cubic millimeters. The finished dry part volume measures 100.00 mm multiplied by 50.00 mm multiplied by 3.00 mm, totaling 15,000.00 cubic millimeters. Volumetric shrinkage equals (15,333.68 minus 15,000.00) divided by 15,333.68, which equals two point one76 percent.
Under a reduced packing pressure of 40 MPa, transverse shrinkage increases to one point two percent while parallel shrinkage shifts to zero point four percent. The modified cavity width requirement expands to 50.607 mm. Insufficient packing pressure directly increases the required steel dimensions and widens part-to-part variation.
DIN 16742 Grade TG4 mandates a total profile tolerance of plus or minus 0.07 millimeters on a 50 millimeter nominal transverse dimension.
Increasing pack pressure beyond 100 MPa reduces transverse shrinkage further, but risks over-packing near the gate, creating high molded-in stress and flash along parting lines. Mold temperature changes crystal growth. Cold steel locks core stress.
Thicker wall sections demand lower melt temperatures and extended pack times to prevent core voiding across matrix domains.
Draft
Tapering vertical cavity walls prevents mechanical binding during component extraction from the steel tool. Shrinkage causes the polymer matrix to pull away from outer cavity walls while gripping internal core pins tightly. Transverse contraction drives this inward clamping force on cores.
Can Transverse Shrinkage Exceed Longitudinal Flow Differential?
Matrix contraction across cross-flow directions frequently reaches three times the parallel magnitude when fiber loading exceeds thirty percent by weight. When flow runs parallel to a core pin, transverse shrinkage contracts directly onto the pin’s perimeter. This circumferential clamping force generates substantial friction during ejection.
High transverse contraction rates require aggressive draft angles on core features to prevent pin scoring and high ejection force spikes. Without sufficient taper, core pins drag against the inner wall, causing surface stress cracks or pin punch-through failures.
Ejection Forces and Mold Steel Friction
Polyamide resins exhibit high surface friction against hardened tool surfaces prior to complete crystallization. High mold temperatures improve surface finish but delay polymer crystallization, leaving the core material soft and prone to distortion during ejection push.
Designing core tooling for transverse-heavy shrinkage zones requires structured execution steps:
- Determine the dominant fiber orientation vectors across vertical rib features using mold filling simulation software.
- Calculate the expected transverse matrix contraction perpendicular to the main flow vectors across the rib height.
- Apply a minimum taper angle of one point five degrees per side for features experiencing high transverse grip.
- Verify ejection pin surface area to keep localized mechanical stress below twenty megapascals at ejection temperature.
Thick sections sink first. Core pin cooling circuits lower pin surface temperatures, accelerating polymer skin formation and reducing high localized friction forces during ejection stroke.
Insufficient wall taper on features aligned perpendicular to flow causes permanent surface scuffing and elevated ejection pin mark depth.

Swell
Atmospheric moisture absorption gradually expands nylon dimensions, reversing a portion of the initial volumetric contraction. Polyamides contain polar amide groups that form hydrogen bonds with absorbed water molecules. Amorphous regions absorb water.

Equilibrium Moisture Contents and Dimensional Growth
Conditioning moulded components at ambient humidity forces water molecules into the amorphous phase of the polymer chain. This water uptake expands the matrix volume, causing measurable dimensional growth. Unfilled polyamide 6 absorbs up to nine percent water by weight at saturation, producing linear swelling up to two point five percent.
Glass fibers do not absorb moisture. Glass content suppresses flow shrink. Fiber-reinforced polyamides absorb less total water proportional to their polymer matrix fraction, but spatial expansion remains anisotropic.
Matrix swelling occurs predominantly perpendicular to fiber orientation vectors, mirroring the initial thermal shrinkage pattern.
| Polyamide Type | Equilibrium Water Content % | Linear Swell Factor % | As-Moulded Shrink Parallel % | Net Dimensional Shift % |
|---|---|---|---|---|
| PA6 Unfilled | 2.80 | 0.70 | 1.25 | -0.55 |
| PA6 GF30 | 1.90 | 0.45 | 0.25 | +0.20 |
| PA66 Unfilled | 2.50 | 0.60 | 1.40 | -0.80 |
| PA66 GF30 | 1.70 | 0.38 | 0.30 | +0.08 |
| PA12 GF30 | 0.50 | 0.10 | 0.35 | -0.25 |
In PA66-GF30, moisture equilibrium at 50 percent relative humidity yields approximately one point seven percent water content by weight. This absorption drives a transverse swell of roughly zero point three eight percent, which almost entirely offsets the initial dry transverse matrix shrinkage. Water expands the polyamide matrix.
Conditioning polyamide parts to equilibrium moisture content before final dimensional inspection eliminates post-moulding assembly binding.
Tolerance Allocation under DIN 16742
Standard international guidelines categorize dimensional variation into molding tolerance and post-moulding environmental response. DIN 16742 defines acceptance boundaries for precision moulded components, accounting for raw material processing tolerance groups from TG1 through TG8.
Precision designs require separating dry-as-moulded dimensions from post-conditioning equilibrium states. Water expands matrix structures while reducing glass-transition temperature, shifting mechanical modulus simultaneously.
Unfilled polyamides undergo greater volumetric shrinkage than glass reinforced grades due to unrestricted crystal formation during cooling.
Designing tool dimensions strictly to dry-as-moulded measurements leads to assembly interference once parts reach atmospheric equilibrium in service.
- Conditioning protocols establish repeatable test baselines by accelerating water absorption in controlled warm water baths before final measurement.
- Measurement timing dictates whether dimensions reflect dry as-moulded contraction or post-conditioning moisture equilibrium.
- Assembly clearances require sizing based on the fully saturated state rather than freshly ejected dry dimensions.
Moisture equilibrium alters physical dimensions. Quality agreements specifying ISO 1110 conditioning prior to dimensional sign-off transfer post-moulding growth risks from molder to buyer.

Ledger
Tooling economics shift dramatically when unpredicted warp forces secondary machining or complex slider mechanisms into cavity steel. Cutting steel once to correct dimensions costs far less than welding and re-machining over-cut cavities. Toolroom practices rely on steel-safe design choices.

Steel Rescaling Costs versus Mold Modification Allowances
Cutting cavity dimensions to the lower tolerance boundary permits subsequent metal removal if matrix contraction proves lower than expected. Adding steel back to an oversized cavity requires expensive wire electrical discharge machining, laser welding, or complete cavity insert replacement.
Transverse matrix shrinkage carries higher statistical uncertainty than longitudinal shrinkage due to gate location variations and flow front instabilities. Sizing transverse cavity features steel-safe minimizes commercial exposure during initial tool trials.
| Modification Type | Steel Condition | Machining Method | Relative Cost Factor | Lead Time Impact |
|---|---|---|---|---|
| Cavity Enlargement | Steel Safe (Safe side) | CNC Milling / EDM | 1.0x | 3 to 5 Days |
| Cavity Reduction | Steel Deficit (Excess removal) | Welding + EDM | 3.5x | 10 to 14 Days |
| Core Pin Reduction | Steel Safe (Pin too thick) | Lathe Turning | 0.5x | 1 to 2 Days |
| Core Pin Expansion | Steel Deficit (Pin too thin) | Pin Replacement | 1.2x | 2 to 4 Days |
Steel corrections require electrical discharge machining. Enlarging a cavity by zero point one millimeter across a transverse dimension incurs basic machining hours, whereas reducing a cavity requires plating or welding steps that compromise steel hardness and polish quality.

Amortisation Impact of Cavitation and Shrink Uncertainty
Multi-cavity tools demand uniform gate geometry to prevent unbalanced pressure drops across identical impressions. Cavity pressure variations of ten percent between impressions create distinct shrinkage profiles, yielding non-identical part dimensions across a single molding shot.
Cavity geometry sets tool cost. Molders quote nominal shrink values. When multi-cavity tools produce out-of-tolerance parts due to transverse shrinkage imbalance, fixing individual impressions inflates the tooling budget and delays production sign-off.
Whether molders can achieve true zero-warp tolerances across complex glass-filled polyamide geometries without resorting to post-moulding fixtures remains open to debate.