Characterizing Biaxial Stretch Properties of Amorphous Polymers
Biaxial stretch testing above glass transition yields multiaxial strain hardening data essential for accurate finite element wall thickness prediction in amorphous polymer thermoforming.

Gauge
Standard uniaxial tension tests fall short when predicting how sheet behaves under thermoforming, stretch blow moulding, or biaxial film orientation. Engineering datasheets derived from ISO 527 or ASTM D638 dumbbell pulls record deformation under single-axis constraint. Heated above glass transition, amorphous thermoplastics subjected to multi-axial stress fields develop molecular chain alignment, entropic strain hardening, and deformation-induced thermal shifts that uniaxial curves miss.
Sizing tooling and process windows on single-axis tensile data leads directly to wall thickness variation, premature corner thinning, and inaccurate cycle time estimates during line bring-up.
Once an amorphous sheet expands biaxially, stress shifts from a simple scalar value to a tensor field with unequal principal components. The principal stretch ratios define the local deformation history. Equal biaxial extension uncoils macromolecular chains isotropically in the plane of the sheet, whereas planar extension holds one lateral dimension fixed and concentrates strain along a single vector.
Uniaxial tension tests allow lateral contraction through Poisson contraction, mitigating stress buildup along the primary axis. In thermoforming and preform blowing, clamp frames or adjacent sheet mass physically constrain that contraction, driving up the effective yield stress and altering the slope of the strain-hardening region.

Uniaxial Test Deficiencies in Biaxial Process Modeling
Characterizing amorphous resins through single-axis pulls introduces systematic errors into finite element simulations. Polymer chains in unplasticized polyvinyl chloride, polycarbonate, polymethyl methacrylate, and polyethylene terephthalate glycol exhibit distinct deformation mechanisms depending on the stress state. Under uniaxial tension above glass transition, entropic entanglement networks disengage through reptation and localized slippage.
Under equal biaxial tension, that same network resists simultaneous planar expansion, raising the effective modulus throughout the initial draw phase.
Simulations driven purely by uniaxial stress-strain inputs systematically under-predict the inflation pressure and plug force required to shape a preform or sheet. Numerical models constructed from uniaxial data assume Poisson ratio values near zero point four nine for rubbery regimes, missing stress-state-dependent entropic hardening. The material appears softer in the simulation than it behaves inside the mould cavity.
As a result, tool drawings generated from uncorrected finite element runs specify plug assist speeds and pre-blow timing sequences that cause local web tearing or excessive wall variation on first-shot trials.

Why Do Uniaxial Stress Strain Curves Fail in Thermoforming Predictions?
Simulating deep-draw thermoforming requires constitutive equations that describe yield, orientation-induced hardening, and thermal softening under simultaneous two-axis deformation. Single-axis tests record a cross-sectional area reduction that accelerates nominal stress drop after yield, masking the true strain-hardening slope of the polymer network. Biaxial deformation suppresses premature necking by spreading strain across two dimensions, allowing the polymer network to reach stretch ratios where entropic strain hardening stabilizes the wall structure.
Sheet temperature largely governs yield behavior. In an industrial process window, temperature gradients across the sheet thickness create localized resistance variations. Uniaxial tests performed in environmental chambers operate under isothermal equilibrium, masking the transient thermal balance of real production lines.
When a heated sheet contacts a cooler plug assist or mould wall, local heat transfer increases the effective flow stress immediately. Uniaxial stress-strain data collected at static temperatures cannot capture this transient thermal-mechanical coupling, leaving simulation engineers unable to predict final wall profiles near sharp corner radii.
Evaluating polymer stretch behavior above glass transition prevents tool recuts. Testing protocols must apply controlled multiaxial strain states while recording force, displacement, and surface temperature concurrently. Measuring true stress requires tracking instantaneous surface cross-section changes, as nominal dimensions derived from actuator displacement corrupt post-yield calculations.

Glass Transition Mechanics under Multiaxial Extension
At temperatures immediately above glass transition, amorphous polymers transit from glassy solids to rubbery entropic networks. The mobility of main-chain segments increases, allowing molecular realignments under applied loads. The rate of application alters the observed mechanical response.
Fast deformation rates freeze segment mobility, shifting the response toward brittle yield, whereas slow deformation rates permit segment relaxation and lower peak force requirements.
| Polymer Chemistry | Glass Transition (C) | Test Temperature (C) | Planar Yield Stress (MPa) | Equibiaxial Hardening Slope (MPa) | Critical Natural Stretch Ratio |
|---|---|---|---|---|---|
| Polycarbonate | 145.0 | 160.0 | 12.4 | 18.6 | 2.85 |
| Polymethyl Methacrylate | 105.0 | 120.0 | 8.2 | 14.1 | 2.30 |
| Polyethylene Terephthalate Glycol | 80.0 | 95.0 | 4.6 | 9.8 | 3.40 |
| Unplasticized Polyvinyl Chloride | 82.0 | 97.0 | 6.1 | 11.2 | 2.65 |
| Methods note: Test parameters recorded at a constant true strain rate of one per second under equal biaxial extension conditions using optical non-contact strain measurement. | |||||
Mapping biaxial yield demands testing across both axes. Evaluating planar and equibiaxial extension across a range of deformation velocities yields the master curves required for temperature-dependent constitutive models. Heat dissipation during rapid biaxial stretching induces localized self-heating, which reduces local stress and accelerates localized necking if strain hardening fails to compensate.
Polymer grades with strong entropic strain hardening redistribute deformation to adjacent, thicker regions, maintaining wall uniformity during high-speed expansion cycles.
At glass transition plus twenty Kelvin, polycarbonate exhibits a planar yield stress of twelve point four megapascals under continuous strain rate loading.
Failure to capture accurate yield and hardening curves across the process temperature band leads to incorrect tool cavity dimensions. Shrinkage calculations depend directly on the degree of molecular orientation trapped during part cooling. When a part cools while holding high multiaxial orientation, post-mould shrinkage becomes highly anisotropic.
Measuring true biaxial properties provides the baseline physics needed to adjust tool steel dimensions before cutting metal.
Whether entropic network saturation limits can be accurately extrapolated at strain rates above one hundred per second without triggering local adiabatic shear banding remains open to physical verification.

Frame
Laboratory characterization of biaxial stretch properties relies on dedicated mechanical testing frames or bubble inflation test benches capable of imposing precise, multi-axis strain paths. Standard universal testing machines cannot deliver non-proportional strain paths or independent two-axis velocity control. Evaluating an amorphous polymer sheet requires hardware designed to grip, heat, and stretch a specimen while maintaining zero spatial movement at the optical center of the specimen grid.
Biaxial stretch frames utilize electromechanical or pneumatic pantograph systems to drive specimen edges outwards. Independent motor drives along orthogonal axes permit equibiaxial, planar, and asynchronous non-equibiaxial testing. Specimen geometry typically features a cruciform profile with engineered corner fillets and laser-cut slots along the outer arms.
These slots isolate individual loading paths, preventing shear stress transfer from the grip clamps into the central optical measurement zone.
Pantograph Actuation and Grip Kinematics
Mechanically gripping a hot, flexible sheet at temperatures above its glass transition presents physical challenges. Standard mechanical wedge grips crush softened polymer edges, inducing early tearing at the clamp margin. Pneumatic or hydraulic scissor clamps equipped with serrated or high-friction ceramic inserts maintain constant holding force as sheet thickness decreases during stretch operations.
If specimen material slips out of a clamp, force-displacement calculations register artificial compliance that shifts measured strain-hardening slopes downwards. Advanced biaxial stretch frames deploy linear optical encoders directly on the clamp carriages to monitor actuator velocity, while simultaneous digital image correlation tracks actual specimen deformation independent of grip displacement.

Optical Strain Mapping and Non-Contact Displacement
Contacting extensometers cannot measure softening polymer sheets above glass transition without marking the heated surface and creating localized stress concentrations that trigger premature failure. Three-dimensional Digital Image Correlation (DIC) provides non-contact displacement and strain mapping across the central specimen zone.
High-resolution stereoscopic cameras capture the motion of a high-contrast speckle pattern applied to the specimen surface. Dedicated software tracks speckle movement across sequential image frames, calculating the full-field deformation gradient tensor. From this tensor, local principal stretch ratios, shear strains, and true strain rates are derived continuously throughout the test duration.
Non-contact optical stereovision tracks strain fields across the central grid. High frame rates are essential when evaluating high-speed inflation processes to ensure strain rate variations are resolved accurately during rapid yield transitions.
Bubble Inflation Protocols for Thin-Sheet Resins
Bubble inflation testing offers an alternative methodology for characterizing equibiaxial stress states in thin amorphous films and extruded sheets. A circular polymer specimen is clamped around its perimeter inside a temperature-controlled pressure cell. Pressurized air or oil inflates the heated sheet into a free dome, creating an equibiaxial stress state at the pole of the bubble.
Measuring bubble pole curvature and wall thickness reduction requires laser profilometry coupled with optical pressure transducer recording. True stress at the pole is derived from Laplace’s law for thin-walled spherical shells, relating pressure, instantaneous radius of curvature, and local thickness. Bubble inflation testing eliminates grip edge tearing issues encountered in pantograph stretch frames, though it restricts testing strictly to equibiaxial strain paths.
Clamping pressures that exceed sheet compressive strength generate localized necking at the specimen perimeter before central yield occurs.
Process engineers utilize biaxial test data to diagnose production line defects. A failure analysis checklist helps isolate apparatus errors from intrinsic material defects during laboratory trials:
- Thermal Non-Uniformity creates localized hot spots across the specimen surface, triggering premature strain localization and invalidating full-field DIC measurements.
- Asynchronous Clamp Motion induces unwanted shear stresses within the central specimen zone, corrupting pure equibiaxial or planar stress state assumptions.
- Grip Edge Tearing initiates micro-cracks at the fillet base of cruciform specimens, terminating tests before the polymer reaches its natural draw ratio.
- Speckle Pattern Degradation occurs when paint coatings crack or detach under high temperature and large stretch ratios, causing optical loss-of-correlation in DIC systems.
- Pre-Test Thermal Sag distorts thin sheets during pre-heating cycles, introducing out-of-plane initial stresses before mechanical loading commences.
A structured laboratory procedure ensures repeatable biaxial stress-strain data acquisition across varying thermal regimes. Skipping calibration steps introduces systemic error into constitutive model fitting parameters.
Uniform sheet heating across the full thickness profile always yields more reliable stretch data than high actuator speeds applied to a cold preform.


Tensor
Translating experimental biaxial load-displacement data into usable material models requires mathematical constitutive formulations. Hyperelastic and visco-hyperelastic models provide the framework for describing non-linear stress-strain behavior in rubbery polymer networks. The fundamental state variable is the deformation gradient tensor, which maps material points from the undeformed configuration to the deformed configuration.
Evaluating true stress demands real-time surface tracking. Nominal stress calculations divide measured force by the initial undeformed cross-sectional area. In large-deformation biaxial stretching, area reductions exceed several hundred percent, making nominal values useless for engineering analysis.
True Cauchy stress represents the real physical force acting on the actual deformed cross-sectional area at any instant during draw.
Hyperelastic Strain Energy Density Formulations
Hyperelastic models assume the existence of a scalar strain energy density function, which defines the stored elastic energy as a function of the strain invariants or principal stretch ratios. For incompressible amorphous polymers, the volumetric stretch ratio equals unity, forcing the product of the three principal stretch ratios to equal one. This constraint simplifies the constitutive equations by expressing the third stretch ratio as the inverse product of the two primary orthogonal stretch ratios.
The Ogden strain energy density model effectively captures the strain-hardening behavior of amorphous thermoplastics above glass transition. The model form is expressed as:
W = sum_{i=1}^N (mu_i / alpha_i) (lambda_1^{alpha_i} + lambda_2^{alpha_i} + lambda_3^{alpha_i} – 3)
Where mu_i and alpha_i are material constants determined through non-linear regression against experimental stress-strain curves. The exponent alpha_i dictates the non-linear curvature and strain-hardening rate, while mu_i defines the initial shear modulus contribution of the polymer network.

True Stress Calculations and Incompressibility Mechanics
Calculating true stress components under equal biaxial and planar conditions requires explicit equations derived from the strain energy density function. For an incompressible material under equal biaxial extension, the principal stretch ratios are defined by equal planar stretch values, while the thickness stretch ratio equals the inverse square of the planar stretch value.
The principal Cauchy stress difference for equal biaxial deformation under the Ogden formulation yields:
sigma_1 – sigma_3 = sum_{i=1}^N mu_i (lambda_1^{alpha_i} – lambda_1^{-2 alpha_i})
Since the out-of-plane stress sigma_3 equals zero at the free surface, the true in-plane stress sigma_1 is calculated directly from the principal stretch ratio and fitted Ogden parameters. Accurate parameter extraction requires simultaneous fitting across multiple stress paths, including equibiaxial, planar, and uniaxial modes, to ensure numerical stability in finite element solvers.
| Material Grade | Model Type | Mu_1 (MPa) | Alpha_1 | Mu_2 (MPa) | Alpha_2 | Coefficient of Determination (R^2) |
|---|---|---|---|---|---|---|
| PC Sheet Grade | Two-Term Ogden | 14.2 | 2.1 | -0.85 | -4.2 | 0.994 |
| PMMA Thermoforming | Two-Term Ogden | 9.6 | 2.4 | -0.42 | -3.8 | 0.989 |
| PETG Extrusion | Two-Term Ogden | 5.1 | 3.1 | -0.12 | -5.0 | 0.997 |
| Rigid PVC Sheet | Two-Term Ogden | 7.3 | 2.7 | -0.31 | -4.4 | 0.991 |
Time Temperature Superposition Shift Functions
Amorphous polymers exhibit strong rate-dependent mechanical properties near their glass transition temperature. Increasing the strain rate shifts the stress-strain response in the same direction as lowering the test temperature. The Williams-Landel-Ferry (WLF) equation quantifies this shift relationship, allowing master curves to be constructed across strain rates that exceed physical laboratory frame limits.
The WLF shift factor equation takes the standard form:
log10(a_T) = -C_1 (T – T_ref) / (C_2 + T – T_ref)
Where C_1 and C_2 are empirical constants specific to the polymer formulation, T is the actual deformation temperature, and T_ref is the chosen reference temperature. Shift factors calculated from small-strain dynamic mechanical analysis often fail at high engineering strains. Parameter verification must use large-strain biaxial test data collected across a temperature matrix spanning the industrial process window.
True principal stresses are calculated by dividing measured load by real-time cross-sectional area. Material modeling teams must execute systematic extraction steps to derive robust constitutive constants for plant simulation engines.
- Mount sheet specimen into pantograph grips and stabilize oven chamber to specified test temperature within zero point five Kelvin accuracy.
- Initiate non-contact optical stereovision system and confirm speckle pattern tracking correlation across the primary measurement grid.
- Apply orthogonal displacement profiles to generate target strain paths including equibiaxial, planar, and non-equibiaxial ratios.
- Log force transducer signals and surface displacement arrays simultaneously at sampling frequencies above one hundred Hertz.
- Convert raw force and displacement arrays into true Cauchy stress and principal stretch ratios using instantaneous thickness fields.
- Perform non-linear least-squares optimization to fit multi-term Ogden or Arruda-Boyce constitutive equations across all acquired stress paths concurrently.
- Validate extracted model coefficients by running single-element finite element simulations and comparing predicted load-extension paths against experimental data sets.
Failure to calibrate temperature dependence through Williams-Landel-Ferry shift factors invalidates finite element thickness predictions across a five-degree thermal gradient.
Exponents in the Ogden model govern the hardening slope. When hyperelastic model exponents are fitted to uniaxial data alone, finite element simulations predict localized wall collapse under multiaxial extension. Multi-axial parameter fitting ensures numerical stability across complex strain fields encountered in preform inflation and complex mold geometries.
Selecting hyperelastic strain energy functions without multiaxial fitting routines causes severe wall necking in thermoformed shells and forces costly tool modification cycles during pre-production qualification.


Domain
Mapping process windows for heavy-gauge thermoforming and stretch blow moulding requires overlaying constitutive material limits onto machine operating boundaries. The process window represents the domain where heating times, plug assist velocities, inflation pressures, and cooling cycles produce acceptable parts without material rupture, excessive wall variation, or severe optical distortion.
Local stretch ratios vary considerably across a moulded geometry, ranging from minimal extension near deep clamping flanges to extreme draw ratios along corner radii and deep recesses. A sheet drawn beyond its natural stretch ratio undergoes rapid orientation-induced hardening, transmitting deformation forces into adjacent warmer zones. If adjacent zones cannot sustain the transferred load, localized wall necking occurs, leading to part failure.

Thermoforming Draw Ratios and Thickness Distribution
The areal draw ratio measures the surface area expansion of a sheet during forming. Higher draw ratios require greater material elongation, which thins the local wall section proportionally. Calculating areal draw ratio alone is insufficient for predicting local wall thickness because material distribution is non-uniform across mold contours.
When a heated sheet contacts a cold mold wall, frictional contact and rapid thermal chilling freeze the polymer, halting further stretching in that zone. Unstretched material remains thick, forcing remaining hot zones to undergo higher stretch ratios to fill the mold cavity. Plug assists made from syntactic foam or temperature-controlled metals alter material redistribution by delaying local chilling and controlling material delivery into deep mold features.
Stretch Blow Moulding Preform Deformations
In stretch blow moulding of amorphous preforms, biaxial orientation develops rapidly during sequential or simultaneous stretch rod movement and high-pressure air inflation. The preform undergoes axial elongation driven by the mechanical stretch rod, followed immediately by radial expansion forced by high-pressure air injection. The timing gap between rod extension and blow air admission defines the biaxial strain path experienced by the preform wall.
Temperature gradients through the preform wall produce uneven deformation across the thickness. The hot inner wall stretches preferentially during initial air injection, while the cooler outer wall resists expansion. Material characterization data collected across varying strain rates allows preform designers to balance wall temperature profiles and preform wall taper angles to achieve uniform container wall thickness.
| Polymer Family | Optimal Biaxial Forming Window (C) | Maximum Areal Draw Ratio | Max True Strain Rate (1/s) | Yield Hardening Transition Stretch | Recommended Plug Assist Material |
|---|---|---|---|---|---|
| Polycarbonate | 155 to 170 | 4.2:1 | 15.0 | 2.1 | Syntactic Foam (120 C) |
| Polymethyl Methacrylate | 125 to 140 | 3.1:1 | 8.0 | 1.8 | PTFE Coated Aluminium |
| Polyethylene Terephthalate Glycol | 90 to 110 | 5.5:1 | 25.0 | 2.4 | Syntactic Foam (85 C) |
| Rigid Polyvinyl Chloride | 100 to 115 | 3.8:1 | 10.0 | 1.9 | Temp Controlled Steel |
Birefringence Mapping and Residual Stress Domains
Biaxial alignment of amorphous polymer chains introduces optical anisotropy, known as stress birefringence. Freezing highly oriented chains in place traps residual stresses within the part wall. Trapped orientation enhances mechanical impact strength along draw directions, but it introduces dimensional instability and warpage if the part experiences elevated thermal environments during service life.
Measuring birefringence across formed parts using photoelastic polariscopes reveals stress concentration domains. High fringe orders correlate directly with high residual molecular orientation and localized frozen-in strain. Adjusting mold temperature, sheet preheat distribution, or cooling dwell times reduces peak fringe orders, producing dimensionally stable parts with minimal post-mould distortion.
Preform orientation profiles verified under ISO 11469 maintain optical clarity only when true strain rates remain within the linear viscoelastic window.
Engineers audit finite element process models against physical part trials to ensure simulation parameters accurately reflect factory realities. A structured decision checklist validates model accuracy before signing off on production tooling drawings:
- Constitutive Model Verification requires checking whether hyperelastic parameters were fitted using multiaxial strain data rather than single-axis tension tests.
- Thermal Profile Integration confirms that real pre-heat temperature fields measured via infrared thermography are mapped onto the sheet mesh before forming simulation runs.
- Friction Coefficient Calibration demands measuring physical contact friction between heated polymer sheet options and specific plug assist materials at process operating temperatures.
- Grid Pattern Strain Auditing compares predicted element area expansion against physical grid patterns etched onto prototype parts evaluated via optical measurement systems.
- Thickness Profile Cross-Checking validates simulated wall thickness contours against destructive ultrasonic or micrometer measurements collected across critical part cross-sections.
Published melt flow indices cannot replace full biaxial characterization, nor does higher melt strength alone guarantee uniform wall distribution during inflation.


Plate
Tooling design for thermoforming and preform stretch moulding converts theoretical deformation windows into steel, aluminium, and syntactic foam hardware. Cut tool dimensions must account for anisotropic thermal shrinkage, material draw distribution, and mechanical ejection requirements. Cutting steel without validated biaxial characterization data forces expensive iterative tool re-cuts and delays production startup schedules.
Shrinkage in amorphous polymers occurs in two distinct phases: volumetric thermal contraction and entropic orientation recovery. Volumetric shrinkage depends on thermal expansion coefficients and cooling rates. Entropic orientation recovery acts along directions of high stretch, pulling material back toward its undeformed state if parts are ejected before glass transition cooling completes.
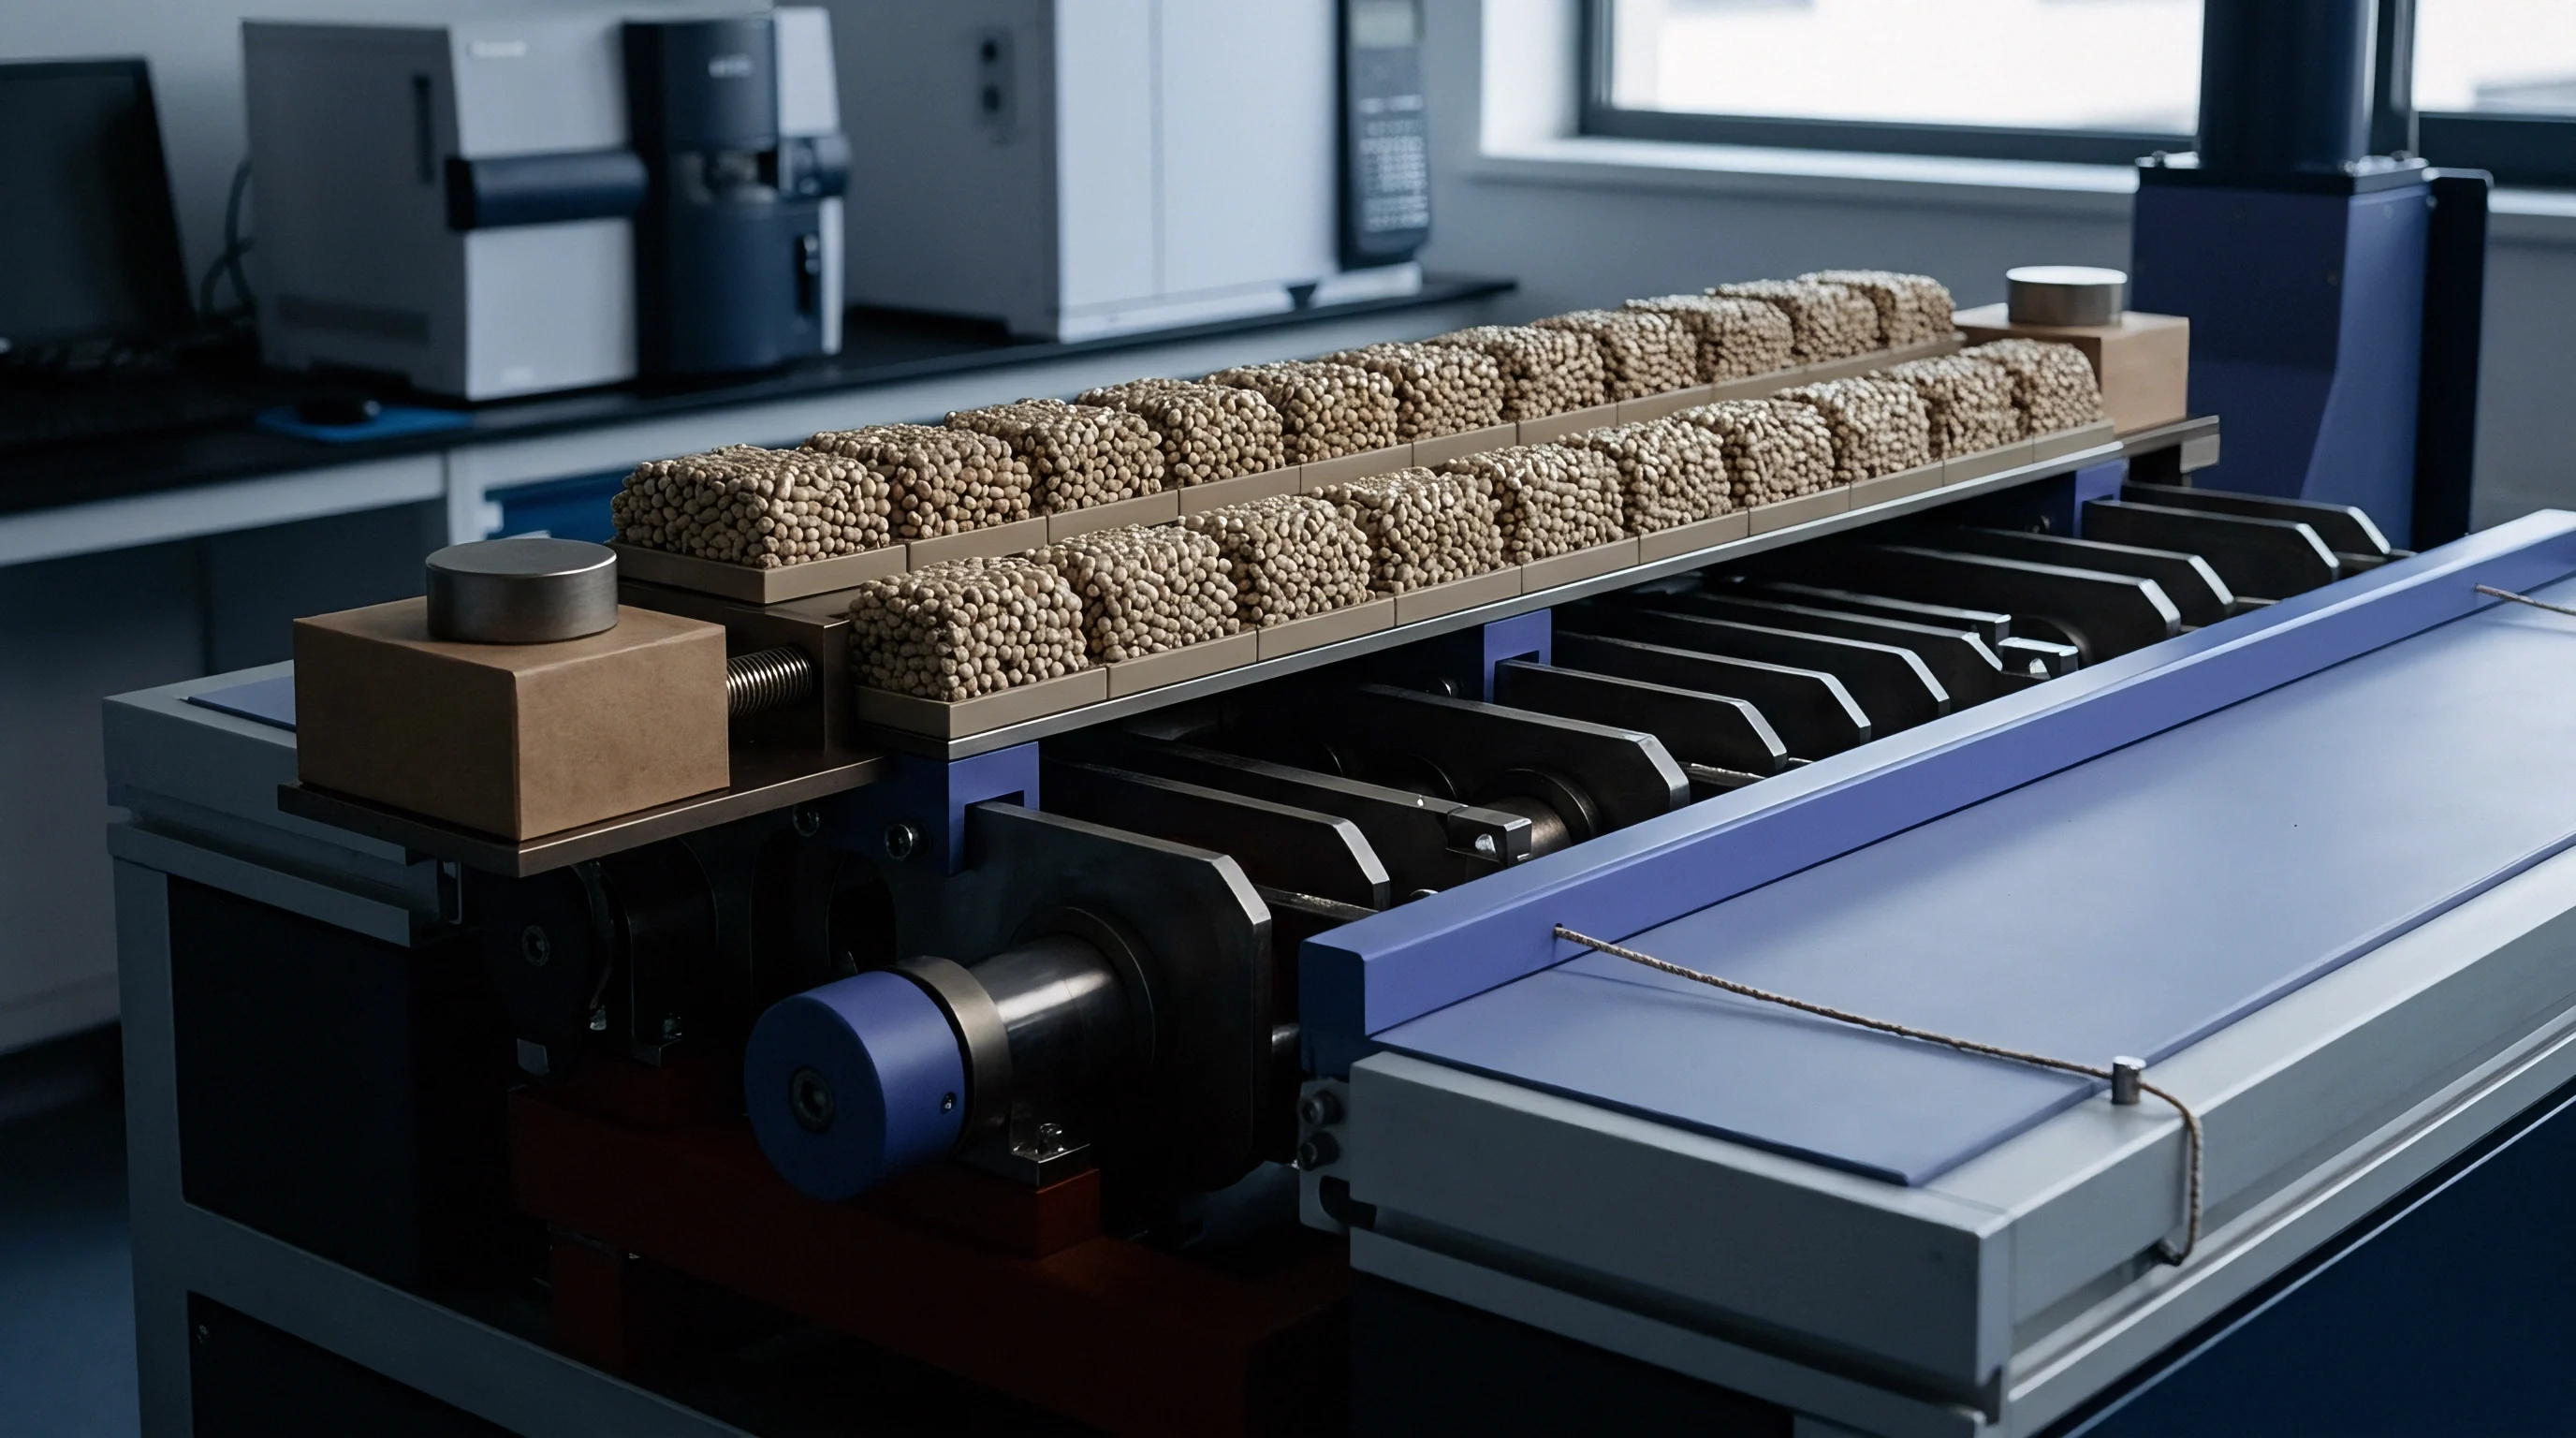
Plug Assist Surface Friction and Heat Transfer
Plug assist design dictates initial material delivery into deep mould cavities. Plug surface texture, thermal conductivity, and operating temperature govern sheet slipping behavior during the pre-draw stroke. Highly polished metallic plugs chill contacting polymer rapidly, locking material on the plug face and forcing subsequent expansion to occur entirely from unstretched peripheral sheet zones.
Plug surface friction redirects material flow. Textured syntactic foam plugs maintain low thermal conductivity, allowing the heated sheet to slip across the plug tip during insertion. This controlled slipping delivers thicker material reserves to the bottom of deep cavity wells, improving final corner wall thickness.
Material characterization data defines the maximum slip velocity permissible before friction-induced surface marring compromises optical clarity.
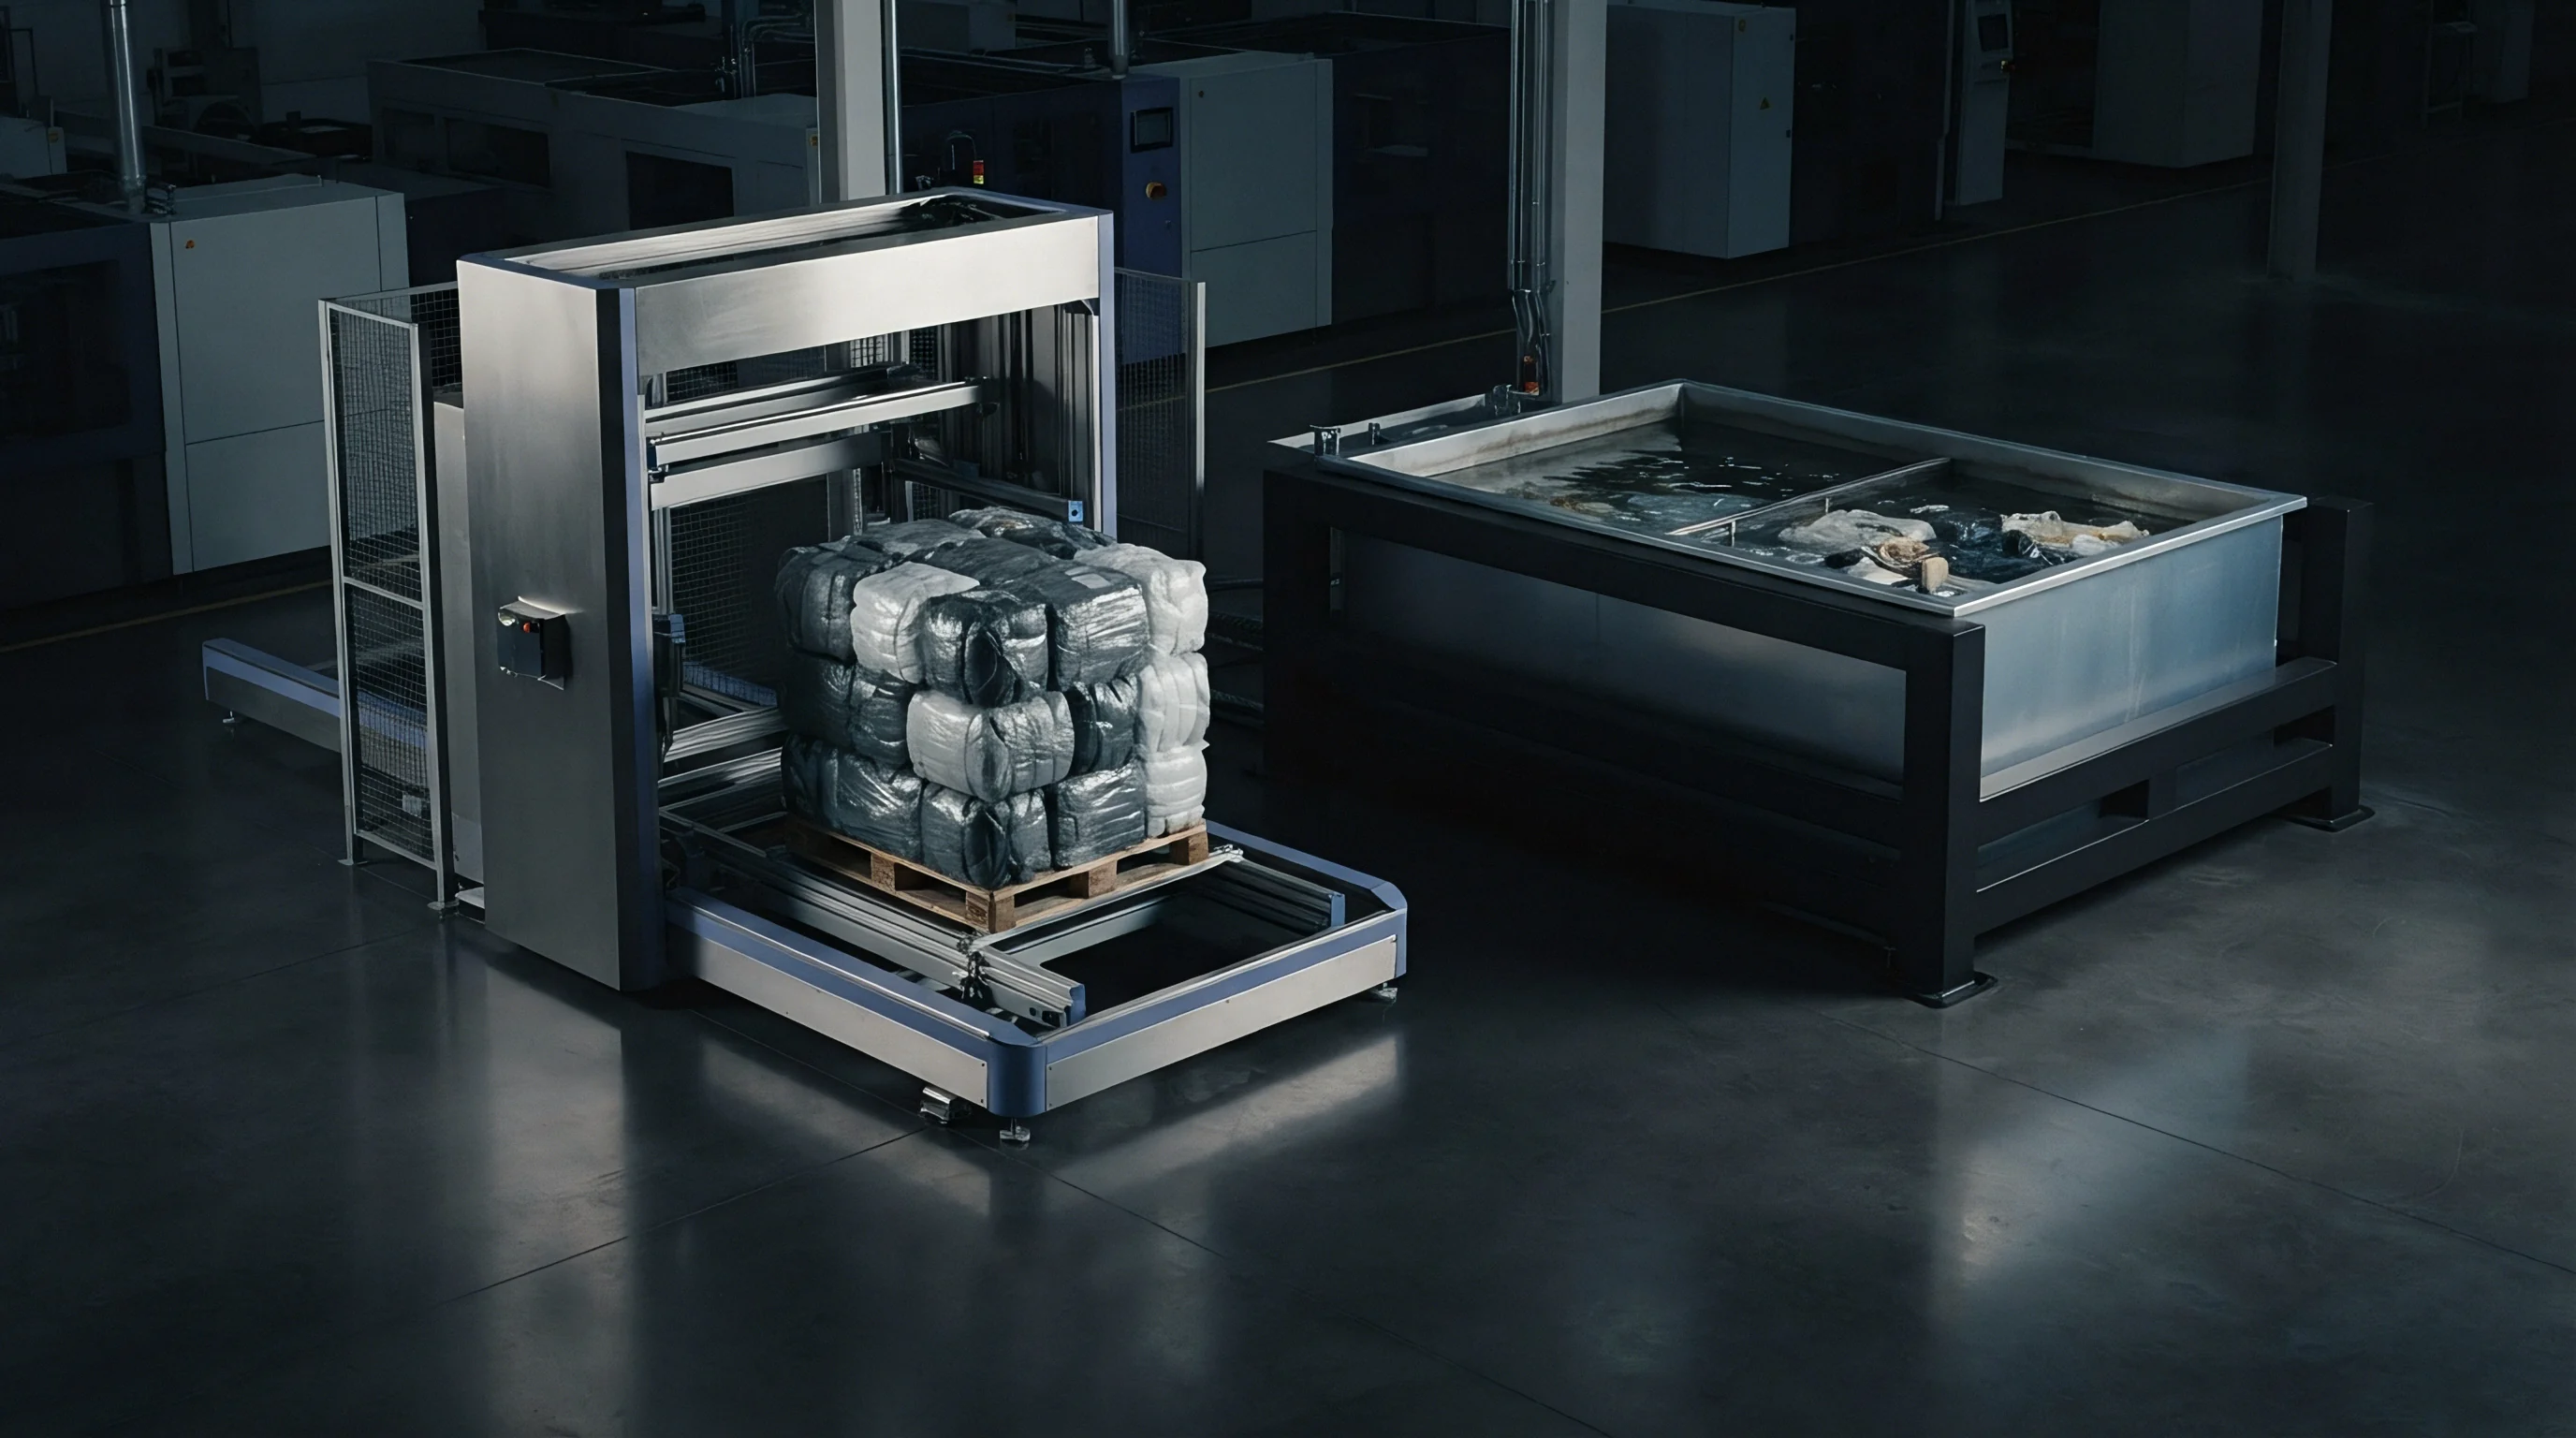
Tooling Geometry Corrections and Shrink Stack-up
Determining cavity dimensions requires applying shrink factors derived from strain-dependent thermal recovery measurements. Isotropic shrinkage assumptions applied to biaxially oriented parts yield out-of-round features, warped mounting faces, and out-of-tolerance boss locations. Mold cavity dimensions must incorporate directional shrink allowances matched to local stretch ratios calculated across the part geometry.
Characterization sets that omit strain rate shift factors miscalculate local shrink behavior. Under-predicting local shrink rates by zero point two percent on a meter-wide thermoformed enclosure results in a two-millimeter assembly mis-match. Toolmakers correct cavity dimensions based on validated finite element predictions before final CNC finishing cuts take place.

Commercial Verification Deliverables and Sourcing Specifications
Procuring production tooling and high-volume moulded parts requires unambiguous engineering specifications and clear sign-off criteria. Standard purchase orders that specify material trade names without binding mechanical property targets leave buyers vulnerable to batch-to-batch resin variance and process instability.
A rigorous tooling purchase specification defines required preform characterization deliverables, simulation matching thresholds, and physical part inspection protocols. Sourcing documentation must mandate specific testing standards and acceptable tolerance grades under recognized international metrics.
- Biaxial Characterization Dossier mandating Ogden model parameter extractions derived from multiaxial stretch testing at three process-relevant strain rates.
- Simulation Thickness Mapping Report requiring finite element thickness predictions across all primary geometry radii prior to initial steel machining authorization.
- Temperature Shift Factor Documentation providing WLF constants validated across the complete material processing temperature window.
- First Article Inspection Metrics specifying wall thickness verification targets across designated measurement zones per DIN 16742 Grade TG4 tolerances.
- Resin Quality Audit Clause stipulating that raw material batch substitutions must meet verified biaxial strain hardening slope thresholds before press setup.
Establishing these verification requirements inside the tooling procurement contract protects capital investments and fixes commercial accountability. Tool sign-off relies on empirical measurement rather than subjective visual appearance, ensuring high-volume manufacturing lines operate with stable cycle times and predictable scrap rates.
Standard supply contracts executed under DIN 16742 Grade TG4 mandate that preform tool sign-off occurs only after biaxial simulation predictions match physical part thickness profiles within three percent across all critical wall zones.