Blow Moulded Bottle Weight Trimmed until the Drop Test Fails
Trimming blow moulded bottle weight reduces unit resin costs but narrows drop test safety margins along bottom pinch seams and heel radii.

Parison

Axial Extrusion Profile and Radial Thickness Distribution
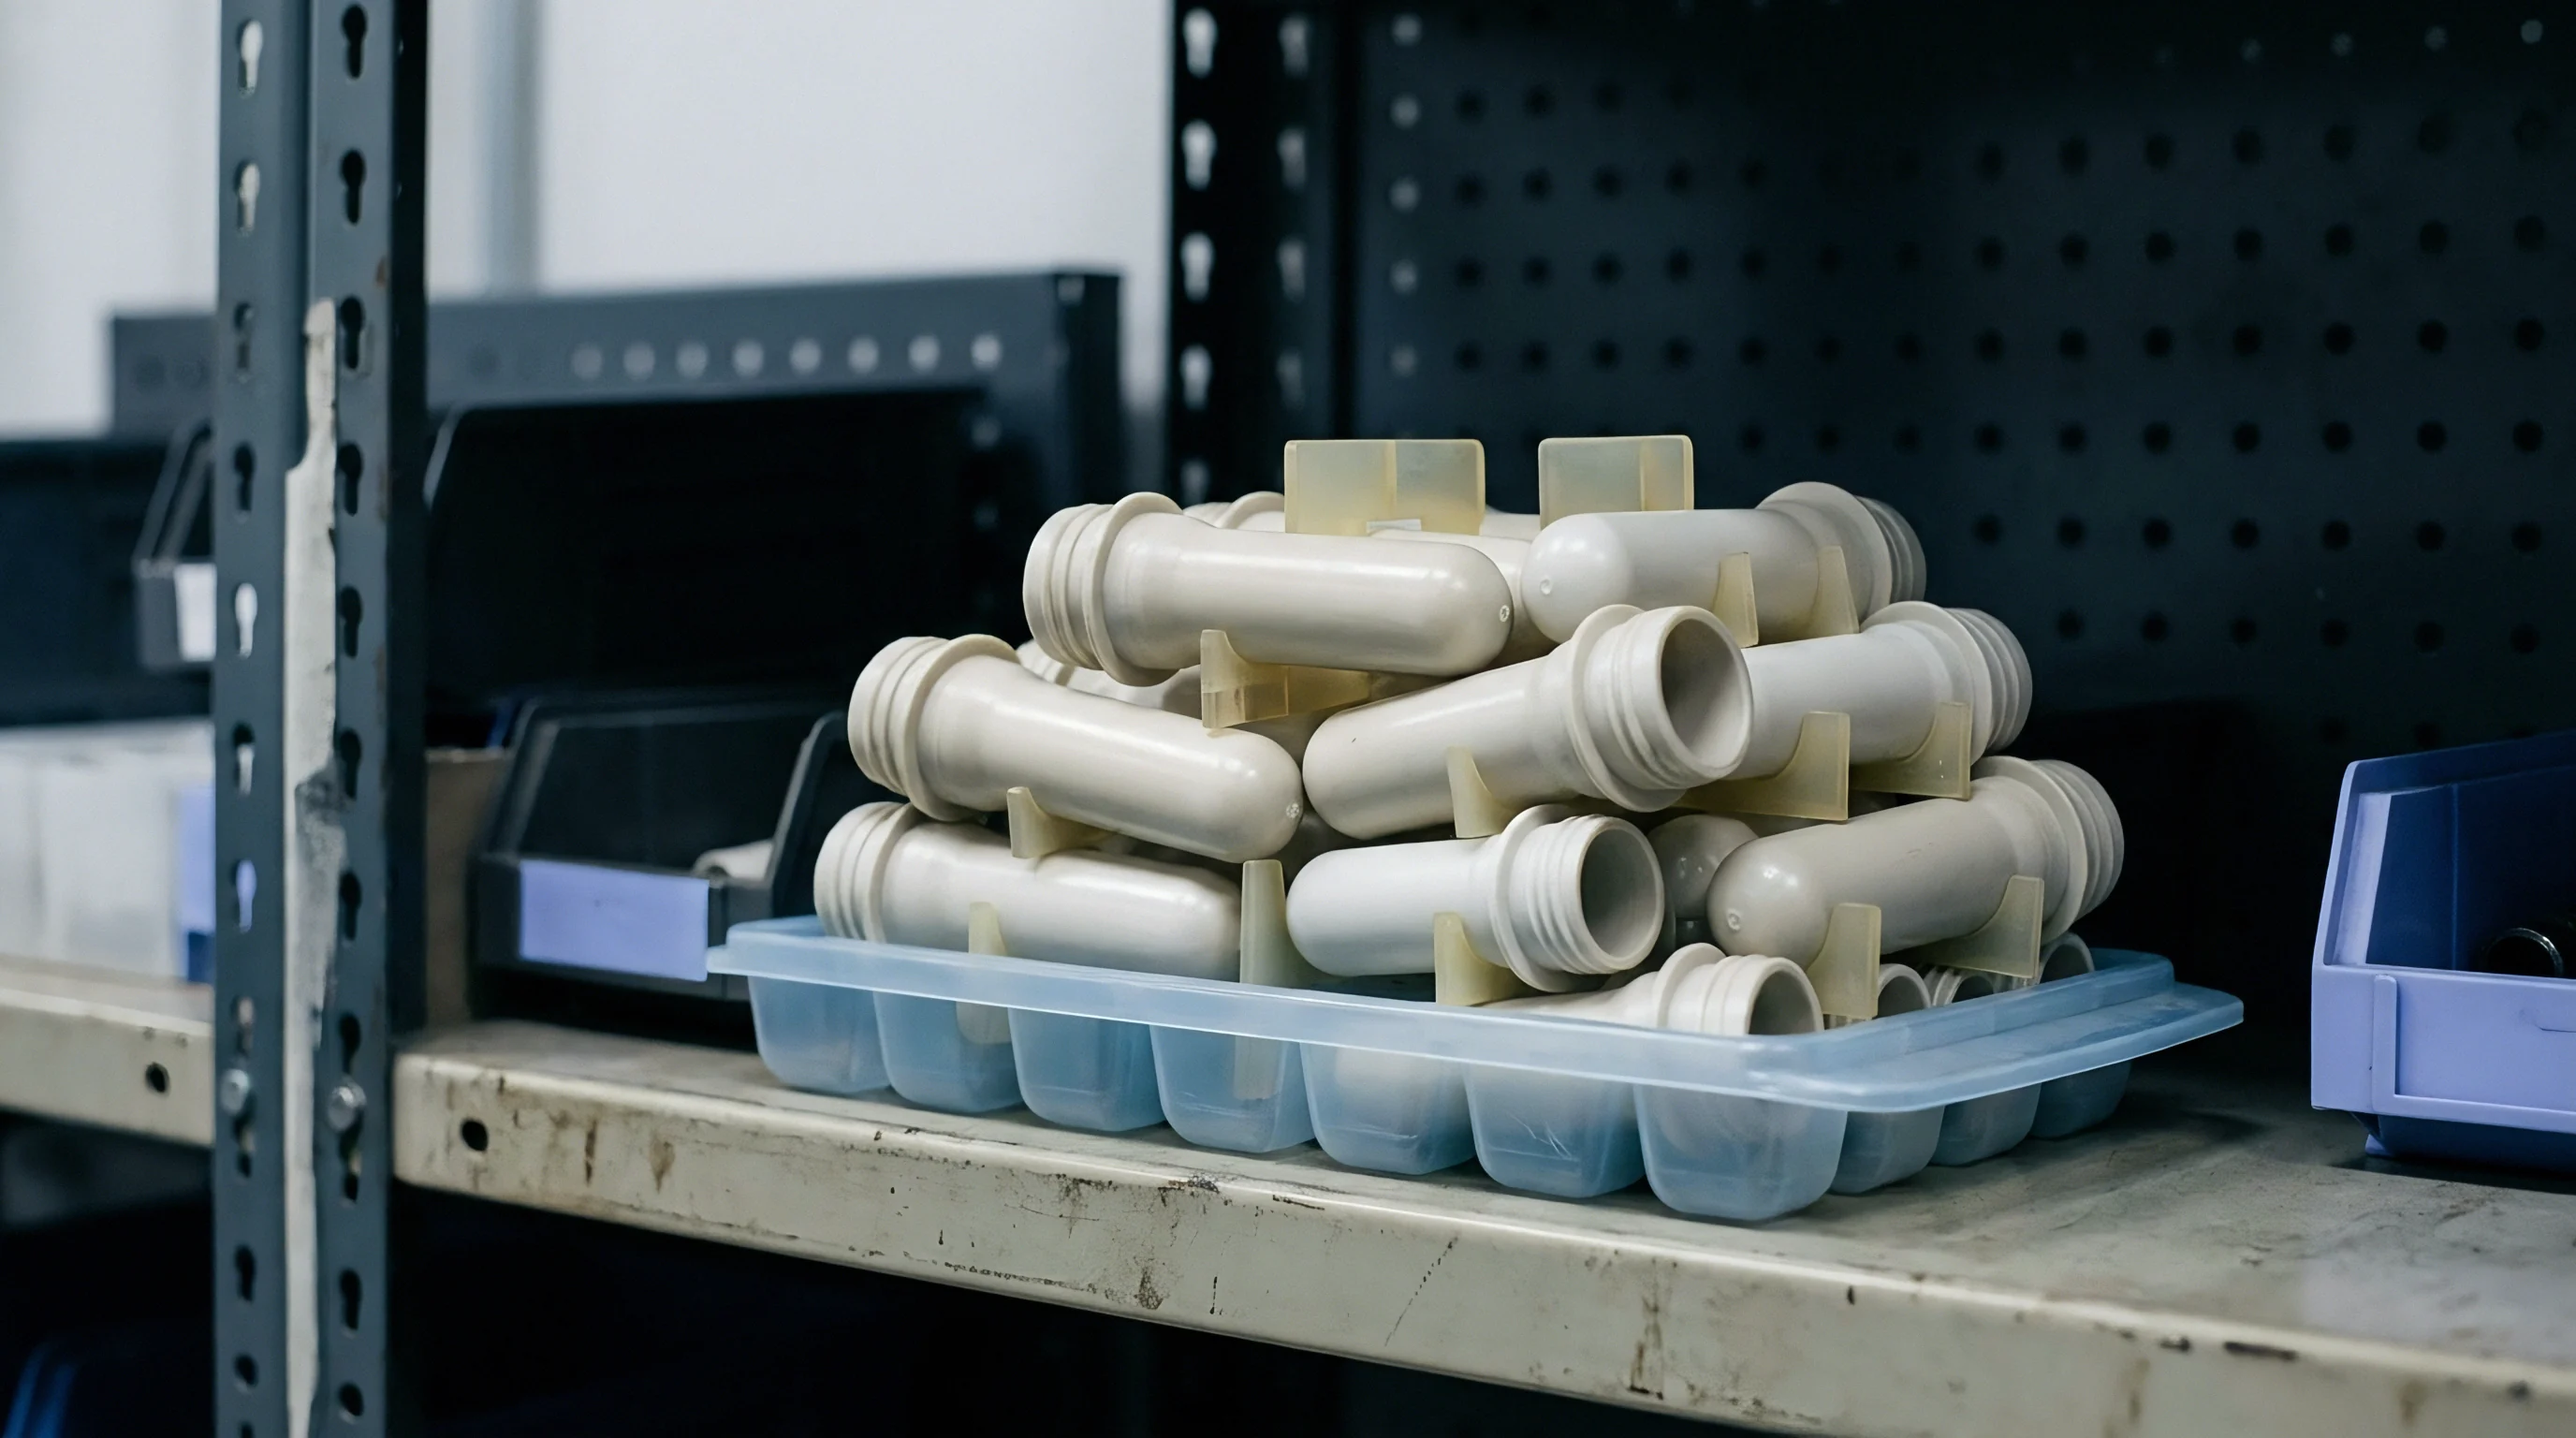
Die head gap adjustments change local wall thickness during extrusion. In extrusion blow moulding, the parison hangs vertically from the die tooling before the mold halves close around it. Gravity causes sag, stretching the upper region of the hot melt tube while the lower portion retains its intended wall dimension.
To counter sag and match bottle shape geometry, automated die positioning systems alter orifice clearance as a function of drop length. Electronic controllers translate length positions into servo-hydraulic actuator movements that shift a tapered mandrel within a stationary outer die ring. Programmed profiles split the container height into distinct vertical segments, assigning a specific tooling gap to each zone.
When a rectangular or oval bottle expands inside the cavity, corner regions undergo greater blow-up ratios than flat side walls. Uniform wall thickness along the parison circumference produces thin corners on blown containers. Radial wall thickness control systems address this imbalance by varying die gap dimensions around the circumference.
Static ovalized mandrels or dynamic core-shifting mechanisms force more polymer melt into areas destined to form high-stretch bottle corners. Balancing radial thickness distribution ensures that corners retain structural rigidity while preventing excessive resin accumulation along flat panels.
Thicker bottle corners require aggressive parison programming steps at the moment of die closure.
Polymer distribution along the vertical axis directly influences container strength. High-density polyethylene melts exhibit non-linear flow behavior as they exit the annular die. Adjusting the gap profile alters local mass distribution, shifting material into high-stress areas like bottle shoulders and base transitions.
Refining this wall profile reduces container mass without sacrificing critical load points. Fine-tuning gap positions demands exact synchronization between extrusion speed and die controller positioning.

Parison Swell Ratio and Polymer Melt Elasticity
Extrusion pressure and die geometry dictate transverse expansion upon exiting the tooling. Parison swell comprises two distinct physical phenomena: diametral swell and wall thickness swell. Diametral swell expands the outer diameter of the extruded tube beyond the land diameter of the die ring.
Wall thickness swell increases the cross-sectional wall measurement while reducing internal diameter. Both swelling effects arise from elastic memory within the polymer melt. Long molecular chains compressed inside die channels relax upon reaching ambient atmospheric pressure, expanding in directions perpendicular to flow.
Resin properties dictate the magnitude of swell during processing. Molecular weight distribution and long-chain branching govern melt elasticity. High-molecular-weight fractions enhance melt strength, preventing excessive parison sag across long drop times.
Broad molecular weight distributions increase swell ratios, demanding smaller die tooling gaps to achieve targeted bottle wall thickness. Operating temperature interacts directly with resin elasticity. Higher melt temperatures reduce melt viscosity, diminishing swell ratios while accelerating gravity-induced sag rates.
| Resin Grade Identifier | Melt Flow Index (g/10min at 190C) | Resin Density (g/cm³) | Swell Ratio Percent Range | Die Gap Range (mm) | Target Pinch Thickness (mm) |
|---|---|---|---|---|---|
| HDPE-EBM-001 | 0.15 | 0.954 | 45 – 52 | 1.20 – 2.80 | 1.85 |
| HDPE-EBM-002 | 0.35 | 0.958 | 38 – 44 | 1.40 – 3.10 | 1.65 |
| HDPE-EBM-003 | 0.55 | 0.952 | 30 – 36 | 1.60 – 3.40 | 1.45 |
| HDPE-PCR-001 | 0.28 | 0.955 | 40 – 48 | 1.35 – 3.00 | 1.75 |
| Data measured at 195C melt temperature using standard annular die geometry with 25mm land length. | |||||
Controlling die land length alters residence time under shear stress before exit. Extended die lands promote molecular alignment, dampening post-extrusion swell behavior. Shorter die lands elevate entrance pressure drops and maximize swell response, helping inflate complex container geometries.
Balancing land geometry against extruder screw speed establishes a repeatable parison diameter. Tooling designers set die ring dimensions based on known swell values for specific polymer grades.
Extrusion blow moulding setups depend on stable melt pressure inside the die head. Fluctuations in screw rotation speed or barrel heating zones alter melt elasticity instantly. Pressure spikes alter the swell ratio, producing wall thickness drift along serial container production.
Continuous monitoring of head pressure ensures consistent wall profiling across extended manufacturing shifts.
Variance in drop impact performance stems from batch-to-batch resin density fluctuations as well as unoptimized die programming.


Mass

Incremental Material Reduction across Functional Bottle Zones
Removing half a gram from the shoulder region preserves impact strength while reducing overall resin cost. Trimming bottle mass requires precise micro-adjustments to individual parison profile points rather than global scaling. Uncontrolled mass reduction weakens functional areas unevenly, causing structural collapse long before overall weight limits are reached.
Container design divides the structure into functional zones: neck finish, upper shoulder, body panel, bottom heel, and base pinch region. Each zone carries specific mechanical responsibilities during handle load, stacking storage, and drop impacts.
Neck finish dimensions must remain invariant during lightweighting programs to prevent cap thread distortion or sealing leakages. Shoulder zones require sufficient hoop stiffness to withstand top-load forces generated during automated filling and capping operations. Body panels require flexibility to absorb internal hydraulic spikes without permanent wall deformation.
Bottom heels transfer shock energy into the floor, requiring thick transition radii. Base pinch seams hold structural integrity under liquid impact shock.
Shifting resin away from low-stress side walls toward critical impact zones maintains drop resistance while dropping overall bottle mass. High-speed optical wall thickness gauges track material distribution along container cross sections. Automated profile modifications target specific millimeter increments along the vertical container height.
Shaving weight from non-critical sidewall regions yields immediate material savings without compromising drop qualification thresholds.
Cooling Rate Dynamics and Mold Cycle Time Optimization
Lower part weight accelerates heat removal through aluminum or beryllium-copper cavity walls. Thermal energy transfer limits extrusion blow moulding productivity. Thicker bottle walls require extended dwell times inside the mold to solidify plastic below its heat deflection temperature.
Removing excess plastic thins the wall, reducing thermal resistance across the plastic-steel interface. Accelerated heat dissipation shortens mold cooling cycles, expanding hourly bottle throughput on production blow moulding lines.
Extrusion melt temperatures for high-density polyethylene typically run between 180 and 210 degrees Celsius. Safe part ejection demands cooling wall centerlines below 70 degrees Celsius to prevent post-molding distortion. Heat transfer rates depend on cooling water temperature, flow velocity, and mold alloy thermal conductivity.
Lightweight bottles reach ejection temperatures faster, cutting cycle times directly.
- Establish baseline container weight, dimensional profile, and drop test failure thresholds using standard production tooling settings.
- Reduce die gap settings in non-critical body panel zones by two percent increments using the electronic parison programmer interface.
- Blow sample bottles at each weight increment, verifying neck finish dimensions, total part mass, and wall thickness profile using ultrasonic gauges.
- Condition blown test samples for twenty-four hours at twenty-three degrees Celsius and fifty percent relative humidity per standard testing environments.
- Perform standard drop testing from target heights, logging failure locations, seam split lengths, and energy absorbing deformation modes.
- Identify the critical threshold weight where drop failure rate exceeds allowable statistical limits, then step back weight settings by one point five percent.
Cooling sets structure and heat removal dictates cycle productivity directly. Rapid cooling yields finer crystalline structures in semi-crystalline polymers, enhancing environmental stress crack resistance. Cooling water channels positioned close to base pinch-off inserts prevent thermal degradation along critical seam joints.
Balancing heat extraction across mold halves prevents container warpage and panel sink marks.
Excessive mass reduction compromises thermal stability during bottle inflation. Thin parisons lose heat rapidly to ambient air before mold closure, generating cool spots that fail to weld cleanly along the bottom pinch seam. Cold seams shatter during impact tests, invalidating resin savings achieved through wall trimming.
Maintaining mold thermal equilibrium prevents seam freezing during high-speed blowing cycles.
Reducing container mass by eight percent decreases required mold cooling time by 1.2 seconds at standard water temperatures.
Trimming target bottle mass beyond the elastic threshold converts an entire production shift into unrecyclable structural scrap when environmental stress crack resistance collapses.

Impact

Hydraulic Shock Mechanics and Liquid Payload Dynamics
Internal hydrodynamic pressure spikes during floor contact force liquid outward against bottle walls. When a liquid-filled container strikes a rigid surface during a drop test, gravitational potential energy transforms into kinetic energy, then converts rapidly into fluid shock pressure upon impact. The liquid payload acts as an incompressible medium, transferring shock waves directly into container walls.
Floor contact decelerates the bottle base instantly, while the liquid column above continues moving downward, generating violent internal pressure surges.
Dynamic wall expansion absorbs fluid impact energy through elastic plastic deformation. The bottom heel transition zone experiences maximum tensile hoop stress as liquid forces container walls outward. Peak fluid pressure occurs within milliseconds of ground contact.
Insufficient wall thickness along the lower panel allows excessive radial swelling, initiating tear failures at local stress concentrations. Higher drop heights elevate peak hydraulic pressure non-linearly, testing material yield strength under ultra-high strain rates.
Viscosity and density of the liquid payload dictate shock transfer characteristics. Dense, low-viscosity fluids like water generate sharp, high-amplitude pressure spikes that test seam integrity. Viscous liquids dampen hydraulic shock, distributing energy over longer impact time windows.
Container headspace volume modifies hydraulic shock behavior significantly. Entrapped air compresses during impact, acting as a pneumatic cushion that absorbs peak pressure spikes. Reducing headspace increases fluid stress against bottle walls dramatically.

When Does Stress Concentration Dictate Drop Failure?
Sharp internal radii in the base pinch-off generate severe localized strain during rigid floor impact. Geometrical discontinuities act as stress multipliers, elevating mechanical forces far beyond nominal wall design calculations. Mold parting line seams, sharp shoulder transitions, and recessed handle grips create focal points where crack initiation begins during impact loading.
Wall thickness drops near bottom pinch-offs exacerbate stress concentration risks.
Base geometry determines how kinetic impact energy disperses across the bottle foundation. Flat bottom surfaces transfer floor shock forces directly into bottom seam welds, maximizing crack risk. Push-up geometries direct impact forces outward toward rounded heel perimeters, converting compressive shock into membrane stress along side panels.
Radius design along the heel transition region determines whether a container flexes elastically or fractures under floor impact.
- Corner heel shear occurs when thin material along corner radii yields under outward hydraulic pressure spikes, causing rapid catastrophic wall tearing.
- Base pinch splitting manifests as brittle seam separation along the mold parting line due to poor thermal fusion or excessive land compression.
- Shoulder flex fracture results from rapid vertical buckling during impact, driving sharp folds into thin upper wall sections.
- Finish thread distortion occurs when fluid hydraulic surges force liquid into cap closure gaps, stripping internal plastic threads.
Impact direction affects failure mode mechanics. Vertical base drops test seam fusion and liquid compression resistance. Angular corner drops induce asymmetric shearing forces across bottom heels, testing wall distribution uniformity.
Horizontal side impact tests wall flexibility and panel buckle recovery. Automated drop testing rigs hold precise bottle orientation, isolating mechanical weaknesses in specific container design zones.
| Bottle Mass (g) | Min Wall Heel (mm) | Drop Height 1.2m Failure Rate (%) | Drop Height 1.5m Failure Rate (%) | Drop Height 1.8m Failure Rate (%) | Primary Failure Zone |
|---|---|---|---|---|---|
| 42.0 | 0.68 | 0.0 | 0.0 | 2.5 | Base Pinch Seam |
| 40.0 | 0.61 | 0.0 | 1.0 | 8.0 | Base Pinch Seam |
| 38.0 | 0.52 | 0.0 | 4.5 | 22.0 | Bottom Heel Corner |
| 36.0 | 0.43 | 3.0 | 18.0 | 54.0 | Bottom Heel Corner |
| 34.0 | 0.34 | 14.0 | 62.0 | 95.0 | Sidewall Panel Flex |
Polymer crystalline structure shifts drop test results significantly. High-density polyethylene exhibits notch sensitivity under rapid strain rates. Material trimmed from critical heel radii increases localized stress, driving cracks along molecular alignment lines.
Drop performance testing requires statistical sampling sizes to establish true mean failure metrics across variable production lots.
Energy transfers fast. Structural design dictates survival when material volume drops below traditional design margins. Rib structures incorporated into side panels redirect hydraulic flex energy into rigid geometric paths.
Spherical base geometries distribute internal fluid pressures evenly, allowing thinner wall profiles while maintaining high-drop survival metrics.
Standard ASTM D2463 testing mandates twenty-four hour conditioning at ambient temperature before drop qualification to eliminate residual mold stress.
Whether multi-axis impact testing reveals structural weaknesses that standard vertical free-fall methods miss remains an open engineering question for asymmetric container designs.


Pinch
Steel Geometry and Pinch Land Dimensions
Mold steel meeting at the container base compresses the extruded tube into a solid structural weld. Pinch-off tooling shapes the bottom seam of blow molded containers. When two cavity halves close, hardened steel pinch lands crush the hot plastic parison together, sealing the bottom floor while severing tail scrap material.
Pinch land width dictates both cutting efficiency and thermal weld strength. Excessively wide pinch lands disperse closure force, producing incomplete scrap separation and ragged seam tails. Narrow pinch lands cut plastic sharply but leave insufficient molten resin volume to build a robust structural weld seam.
Pinch land widths typically measure between 0.38 mm and 0.76 mm for high-density polyethylene containers. Steel pinch edges require specific relief angles behind the land face to accommodate extruded tail scrap. Relief angles ranging from 15 to 30 degrees permit excess plastic to flow smoothly into tail pockets without creating high back-pressure that pushes plastic out of the welding zone.
Clean tail pockets prevent scrap plastic from jamming mold parting lines during high-speed continuous cycles.
Tooling steel selection impacts pinch longevity and seam quality directly. High-grade tool steels hardened to 52-56 HRC resist wear caused by abrasive resin additives and continuous cyclic pounding. Beryllium-copper insert blocks placed along pinch zones enhance local heat extraction, rapidly freezing bottom seams to cut cycle times.
Precision CNC grinding maintains uniform pinch land clearance across the entire mold parting line.

Parison Seam Fusion and Weld Zone Crystallinity
Thermal energy remaining in the squeezed plastic determines bond strength along the bottom seam. Squeezing semi-molten plastic forces polymer chains across the interface, forming molecular entanglements that unify opposing parison walls. If parison melt cools excessively before mold closure, molecular diffusion halts, creating a weak mechanical contact boundary instead of a true thermal fusion weld.
Cold welds break instantly under hydraulic shock generated during drop testing.
Seam fusion depth depends on applied closing force and parison wall thickness before impact compression. High closing pressures force molten plastic into the central seam pocket, creating a raised inner bead along the bottle interior base. This internal weld bead reinforces the joint against tensile shock loads.
Excessive pinch squeeze flushes hot melt outward into the tail pocket entirely, starving the weld zone and leaving a thin, brittle junction.
Pinch pocket depth controls plastic displacement around the seam weld. Damaged or worn pinch lands produce thin weld lines with severe notch geometries. Notch sensitivity in semi-crystalline polymers like high-density polyethylene causes drop impact cracks to propagate rapidly along damaged seam roots.
Regular inspection of mold pinch steel prevents unexpected drop test failures traced directly to tooling wear.
Thermal management around pinch inserts controls local crystalline structure formation. Slow cooling along thick pinch welds permits high polymer crystallinity, increasing stiffness but reducing fracture toughness under dynamic drop impact. Accelerated cooling through directed water channels preserves amorphous regions within the seam matrix, yielding flexible, impact-resistant weld bonds.
Balancing cooling rates across pinch zones optimizes both seam strength and production speeds.
Evaluating pinch line integrity requires cross-sectional microscopic inspection of base seam welds. Microscopic analysis confirms weld bead symmetry, internal notch depth, and molecular bond homogeneity across compressed polymer interfaces. Defect-free seam structures exhibit continuous resin flow across central weld axes without micro-void inclusion or trapped air pockets.
| Tooling Steel Spec | Land Width (mm) | Relief Angle (deg) | Tail Pocket Depth (mm) | Weld Bead Height (mm) | Seam Drop Survival Rate (%) |
|---|---|---|---|---|---|
| P20 Tool Steel | 0.30 | 15 | 1.50 | 0.12 | 68.0 |
| P20 Tool Steel | 0.45 | 30 | 2.00 | 0.35 | 98.5 |
| BeCu C17200 | 0.50 | 30 | 2.20 | 0.42 | 99.5 |
| Ampco 940 | 0.65 | 45 | 2.50 | 0.55 | 92.0 |
| H13 Hardened | 0.85 | 45 | 2.50 | 0.68 | 81.0 |
Adjusting closing speed during the final mold contact phase alters weld bead formation dynamics. Rapid final closing strikes hot plastic aggressively, generating high shear rates that promote molecular chain orientation parallel to the seam line. Parallel molecular orientation reduces cross-seam tensile strength, making bottom joints susceptible to drop failure.
Controlled closing deceleration permits relaxed molecular orientation across seam boundaries, expanding transverse impact tolerance.
Tail scrap flash removal mechanisms pull flash away from solidified bottle bases automatically. De-tabbing forces must pull parallel to pinch seams rather than perpendicular to avoid tearing warm base plastic before full structural solidification occurs. Clean de-tabbing leaves flat pinch profiles that distribute floor impact loads evenly across bottle foundations.
- Land width calibration maintains compression ratios required to fuse inner plastic beads without starving weld joints.
- Tail pocket depth accommodates displaced scrap volume, preventing high back-pressure from parting mold halves.
- Cutting edge relief ensures clean tail separation, eliminating flash remnants that concentrate floor impact forces.
- Cooling line proximity controls local crystallization rates, balancing seam toughness against mold cycle times.
Narrow pinch lands promote clean scrap tail deflashing but degrade base seam impact resistance during drop testing.
Deepening tail pockets while rounding sharp pinch edges prevents premature seam splitting without compromising automated de-tabbing performance.

Audit

Ultrasonic Wall Measurement and Non-Destructive Inspection
Magnetic probe sensors track wall uniformity across key stress points without destroying production samples. Hall-effect thickness gauges utilize a small magnetic target ball placed inside the container, held against an external magnetic probe applied to the outer bottle surface. As the technician slides the probe along bottle contours, internal ball tracking measures wall thickness with sub-millimeter precision.
Ultrasonic measurement devices transmit high-frequency sound waves through plastic walls, calculating thickness by timing acoustic echoes reflected from internal surfaces. Non-destructive thickness testing permits high-frequency sampling across live production streams.
Wall thickness audits map material distribution across defined grid matrices. Technicians mark target inspection points along container shoulders, side panels, corner heels, and bottom pinch zones. Comparing live production thickness metrics against engineering drawing specifications flags parison distribution drift immediately.
Automated multi-point measurement fixtures speed inspection routines, logging spatial thickness profiles into statistical process control databases continuously.
Mass dictates failure, and real-time mass tracking provides rapid feedback on extruder output stability. Automated inline weighing scales weigh blown containers immediately following de-tabbing operations, rejecting parts that fall outside narrow gram weight limits. Fluctuations in part mass indicate extruder screw feed instability, barrel temperature drift, or raw material bulk density variations.
Rapid detection prevents lightweight parts from entering packaging streams where drop failure risks exist.
Destructive sectioning supplements non-destructive electronic testing protocols. Optical comparators and precision calipers measure cut bottle sections directly, verifying electronic sensor calibration accuracy. Sectioning reveals internal geometry features, such as weld bead symmetry and corner radius profiles, that remain invisible to surface ultrasonic probes.
Regular cross-calibration maintains dimensional inspection integrity.

Quality Sign-Off and Statistical Process Control Limits
Upper and lower control limits dictate when machine adjustments are permitted on the blow moulding floor. Applying statistical process control methodology to bottle mass and wall thickness prevents unnecessary machine operator tampering. Process capability indices, measured as Cpk values, evaluate whether blow moulding parameters maintain target container dimensions within specified tolerance bands.
Achieving Cpk metrics above 1.33 confirms stable, repeatable lightweight container production capability.
Logging wall thickness distribution measurements across automated production runs builds process baseline capability maps. Statistical data collection isolates true machinery drift from natural raw material variations. Capability mapping ensures that trimmed container weights leave sufficient safety margins above absolute drop test failure thresholds across full production campaigns.
Acceptance sampling protocols follow standardized international framework guidelines, such as ISO 2859-1. Inspection lots undergo drop qualification testing based on statistical risk criteria set by acceptable quality limits. Sampling plans define exact part quantities selected per lot, drop heights required, pass thresholds, and immediate lot rejection conditions.
Strict lot acceptance controls prevent under-weight or mis-profiled container shipments from reaching commercial filling operations.
- Parison programmer mapping documents specific gap position codes assigned to every vertical station height on the die controller.
- Resin melt flow certificate records lot-specific melt index and density figures verified against incoming material standards.
- Drop test staircase record logs drop performance heights and failure distribution trends derived from Bruceton test sequences.
- Dimensional inspection matrix summarizes Hall-effect wall thickness measurements collected across designated container inspection zones.
Establishing formal raw material acceptance criteria prevents resin lot variations from destabilizing lightweight production windows. Melt flow index shifts greater than ten percent alter parison swell behavior noticeably, requiring die head profile recalibration. Demanding certified mill test reports with incoming resin shipments ensures consistent elasticity characteristics essential for precision parison programming.
Dossier sign-off documents validate process capability before commercial tool clearance. Quality assurance teams verify that sample bottles survive required drop standards while operating at lower process limits. Documenting tooling setups, water flow rates, and programmer recipes freezes validated production windows firmly.
Purchasing agreements referencing DIN 16742 standard tolerance groups allow resin weight deviations within three percent before triggering formal customer re-qualification.


Ledger

Resin Consumption Economics and Savings Calculations
Calculating annual material expenditure requires evaluating unit weight reductions against total container order volumes. Resin costs represent sixty to seventy percent of total blow molded packaging manufacturing expenses. Trimming part weight directly yields substantial raw material savings over high-volume production schedules.
High-density polyethylene resin pricing fluctuates based on global petrochemical supply balances, making weight optimization an essential hedge against raw material cost spikes.
Calculating annual financial savings derived from container weight reduction relies on direct linear equations: Save = Volume (Mass_Initial – Mass_Final) Price_Resin Where Volume represents annual units produced, Mass values reflect container weights in kilograms, and Price_Resin represents landed raw material cost per kilogram. A container manufacturing facility producing fifty million units annually trimmed by two grams per bottle saves one hundred metric tons of resin each year. At a resin cost of one dollar and thirty cents per kilogram, direct material savings equal one hundred thirty thousand dollars annually.
Calculating payback schedules on tooling modifications balances re-tooling capital expenditure against projected resin savings. Recutting pinch-off steel inserts or purchasing specialized radial wall programming tooling involves distinct upfront mold shop costs. Comparing amortized tool modification costs against monthly material savings establishes clear financial break-even timelines.

Tooling Modification Expenses versus Cycle Time Gains
Modifying die head tooling carries fixed machine shop charges that must be offset by operational efficiency. Precision CNC machining, replacement core mandrels, and dynamic wall control actuators require significant initial capital outlay. However, trimming container mass generates financial benefits beyond simple resin cost reduction.
Thin-wall containers cool faster inside mold cavities, permitting reduced machine cycle times that expand overall factory production capacity.
| Weight Shift (g) | Resin Savings / 10M Units ($) | Cycle Time Shift (s) | Capacity Increase (%) | Scrap Cost Risk ($) | Net Annual Value ($) |
|---|---|---|---|---|---|
| -1.0 | 13,000 | -0.3 | 2.5 | 1,200 | 21,800 |
| -2.0 | 26,000 | -0.7 | 5.8 | 2,800 | 48,200 |
| -3.0 | 39,000 | -1.2 | 10.0 | 8,500 | 68,500 |
| -4.0 | 52,000 | -1.8 | 15.0 | 28,000 | 54,000 |
| -5.0 | 65,000 | -2.2 | 18.3 | 85,000 | -12,000 |
Machine hour rate economics multiply savings achieved through cycle time reductions. Running a large continuous extrusion blow moulding system costs eighty to one hundred fifty dollars per machine hour in power, labor, and overhead allocations. Decreasing mold cycle time by one second on a twelve-second cycle expands machine output capacity by eight point three percent.
Higher unit output per machine hour reduces fixed overhead cost allocation per finished bottle.
Mass reduction balancing requires calculating financial loss risks associated with heightened product scrap rates. Trimming container mass closer to drop test failure thresholds narrows machine processing windows. Minor process drift or ambient factory temperature changes risk driving bottle dimensions into non-conforming drop failure zones.
Elevated scrap rates rapidly erase resin savings through wasted energy, labor, and regrind reprocessing expenses.
Total cost modeling balances resin savings, machine cycle gains, tooling amortization expenses, and scrap risk exposure into unified financial return calculations. Optimization stops at the precise weight point where incremental resin savings equal incremental scrap failure costs. Establishing this financial equilibrium point protects profit margins while achieving competitive package performance metrics.