Verifying Polyethylene Hydrostatic Balance Test Calibration for Entry
Polyethylene hydrostatic testing requires degassed, temperature-corrected fluid baths and void-free plaques to prevent false 0.002 g/cm³ receiving rejections.
Buoyancy
Analytical scales fitted with under-bench hydrostatic rigs determine solid polyethylene density by comparing specimen gravitational force in air against net upward thrust in a liquid bath. Incoming inspection docks run ISO 1183-1 Method A and ASTM D792 to intercept out-of-specification resin lots before pneumatic lines blow 30-tonne deliveries into storage silos. A discrepancy of 0.002 g/cm³ shifts environmental stress crack resistance by an entire performance tier, alters mold shrinkage by 0.3 percent across thick-walled pipe sections, and invalidates processing windows for high-speed film extrusion lines, largely because density dictates crystallite volume fraction.
Polyethylene presents an inherent measurement hurdle during water submersion because the polymer floats. Homopolymer high-density resin sits near 0.955 g/cm³, linear low-density octene copolymers float near 0.918 g/cm³, and very low-density packaging grades drop below 0.900 g/cm³. Laboratory technicians resolve this positive buoyancy either by attaching a calibrated sinker in distilled water or by substituting an organic liquid possessing lower baseline density than the polyolefin matrix.
Both routes introduce systematic errors into the calibration chain that distort incoming receiving logs when ambient laboratory parameters fluctuate.
A thermal shift of 0.5 °C in distilled water at 23.0 °C alters reference liquid density by 0.00011 g/cm³, corrupting the third decimal place of incoming resin density certificates.
Displacement Mechanics under Archimedes Principle
Gravitational mass determinations in air neglect atmospheric buoyancy unless true vacuum mass corrections apply. Ambient air at 23.0 °C and 50 percent relative humidity exerts a buoyant force on polymer specimens, displacing an average air density of 0.00119 g/cm³. When weighing a low-density polymer against stainless steel balance weights calibrated to 8.000 g/cm³, the uncorrected air mass understates true mass by approximately 0.12 percent.
Suspending that specimen within an immersion fluid generates upward buoyant force proportional to the volume of liquid displaced. Accurate calculation requires exact values for immersion liquid density at the test temperature, specimen mass in air, combined mass of specimen and suspension assembly in fluid, and isolated mass of the suspension rig alone. Software embedded in modern digital balances automates these calculations through internal routines, yet the hardware cannot evaluate whether the operator zeroed the suspension wire at the exact liquid immersion depth used during sample submersion.
Thermal Expansion Coefficients of Immersion Media
Volumetric expansion of the immersion liquid represents the largest single environmental variable in hydrostatic testing. Deionized water exhibits a thermal expansion coefficient near 0.00021 per degree Celsius at standard laboratory baseline temperatures of 23.0 °C. Industrial alcohols such as reagent-grade isopropanol and anhydrous ethanol, commonly selected to sink polyethylene without auxiliary hardware, exhibit thermal expansion coefficients exceeding 0.00100 per degree Celsius. Unmonitored temperature swings shift calculations across shifts.
Organic liquids evaporate rapidly into the draft shield chamber. Vapor accumulation chills the fluid boundary layer, creating vertical thermal gradients inside the beaker. An immersion beaker reading 23.0 °C at the base can register 22.1 °C near the evaporating surface.
The resulting buoyancy gradient renders balance readings unstable, producing apparent mass drift during standard 30-second settling windows. When incoming receiving bays rely on alcohol submersion without jacketed circulators, density records drift upward over morning shifts, leading quality teams to reject compliant deliveries while accepting degraded lots carrying heavy antioxidant burn.
Bath
Beakers holding the fluid medium transfer vibration, thermal energy, and capillary forces directly onto the weighing pan through the suspension wire. Stable hydrostatic calibration demands rigorous fluid conditioning before zeroing the instrument. Dissolved gases, thermal stratification, and surface tension drag at the liquid-gas interface corrupt raw balance readings by magnitudes exceeding the difference between blow-molding and injection-molding resin grades.
Deionized water must undergo active degasification prior to immersion measurements. Boiling the fluid for twenty minutes followed by covered cooling to 23.0 °C, or exposing the vessel to an ultrasonic bath under mild vacuum for thirty minutes, strips entrained microbubbles. When undegassed tap water enters the beaker, minute air pockets nucleate along specimen surface asperities and suspension wire contours, creating parasitic positive buoyancy that lowers apparent polymer density.
Degassing cycles conducted without continuous temperature monitoring yield fluid density tables disconnected from the physical beaker state.
Surfactant Concentration and Meniscus Drag
Pure water displays a surface tension of approximately 72.8 mN/m at 20.0 °C, generating pronounced upward vertical force against any wire penetrating the liquid interface. Wetting agents such as non-ionic alkylphenol ethoxylate or fluorosurfactant compounds depress fluid surface tension to 28.0 mN/m, smoothing the contact line. Adding too much surfactant creates problems of its own: excessive surfactant concentrations increase liquid density, alter fluid viscosity, and cause dense foam to cling to balance hangers.
The diameter of the suspension wire dictates the boundary of meniscus drag error. Fine platinum, tungsten, or phosphor-bronze wires having diameters between 0.08 mm and 0.13 mm limit interfacial vertical force to fractions of a milligram. Operators using heavy stainless steel fishing wire measuring 0.50 mm introduce meniscus variances up to 3.5 mg as the fluid level moves up and down during sample entry.
Will Immersion Liquid Degassing Alter Apparent Mass?
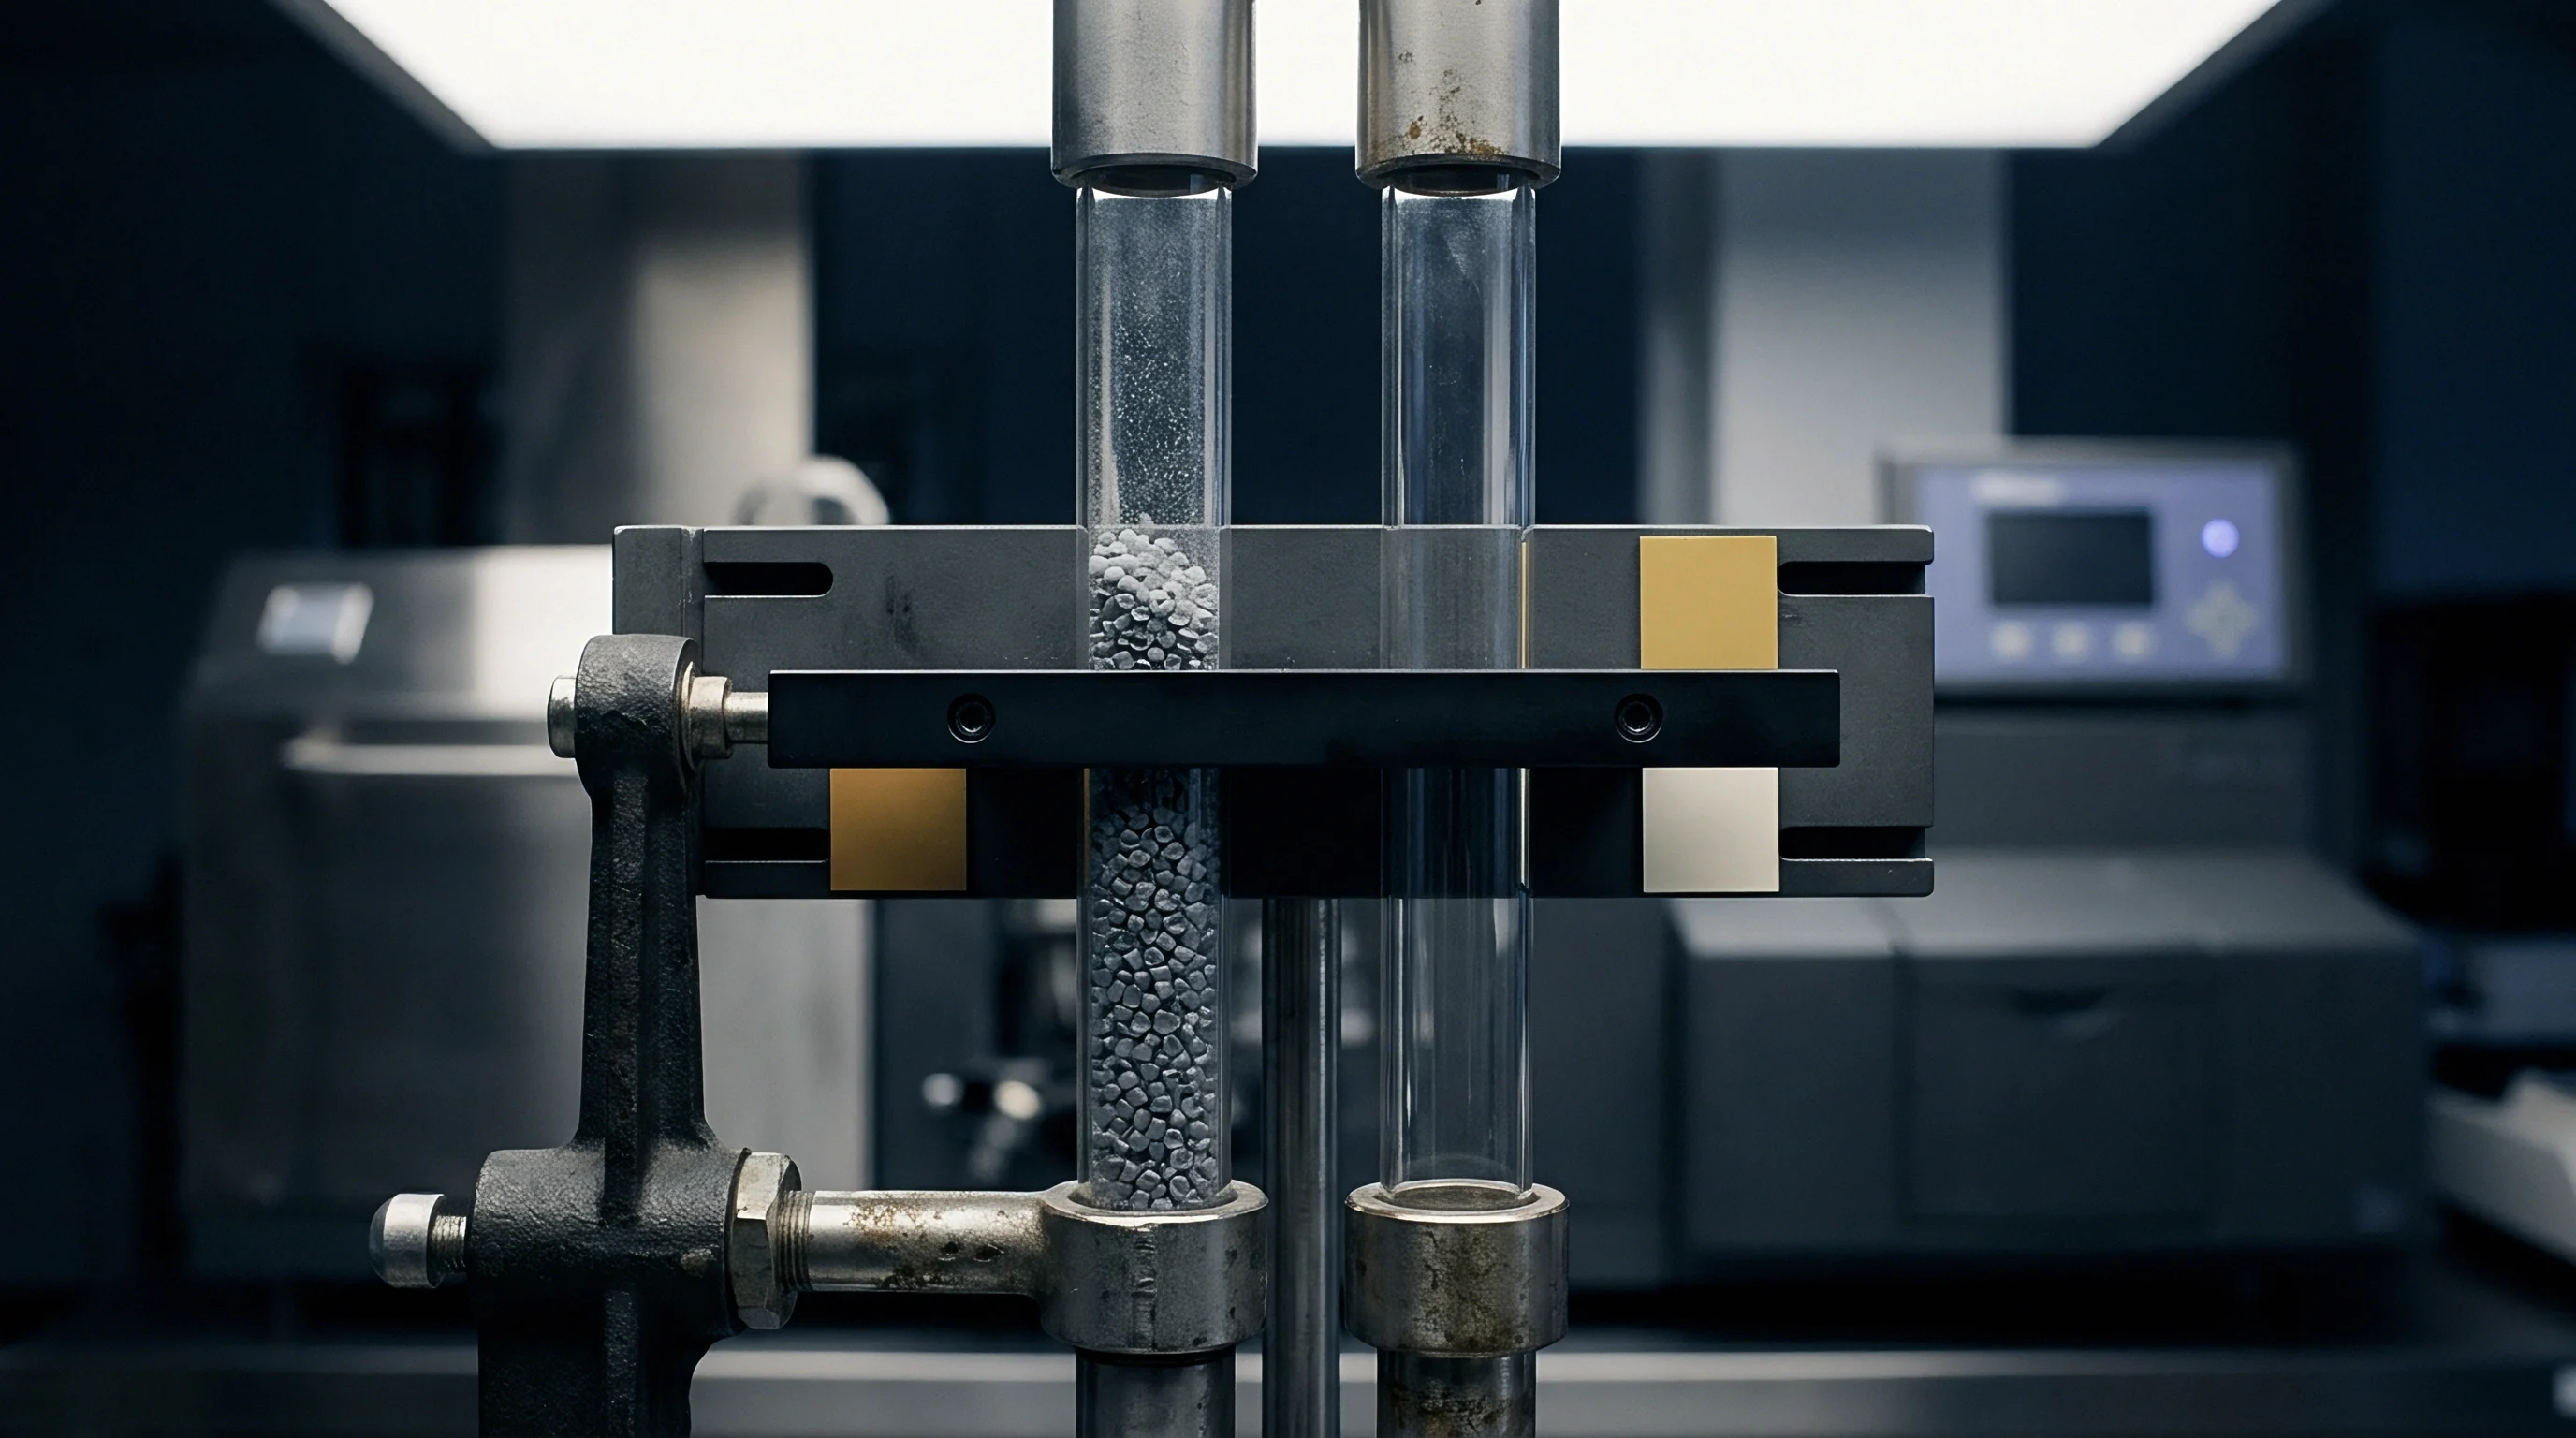
Atmospheric gas molecules dissolved in the immersion bath escape into tiny voids across polymer pellet surfaces. Ultrasonic cavitation strips these trapped air pockets before pellets enter the suspension cage. When technicians skip this cycle, microbubbles cling tenaciously to the textured facets of sheared virgin pellets.
A single microscopic bubble measuring 0.5 mm in diameter contributes roughly 0.065 mg of positive buoyant lift. Against a standard 1.5-gram polyethylene test specimen, three such bubbles shift reported density downward by 0.00015 g/cm³.
Standard operating procedures at compounding facilities address this issue by defining fluid replenishment cycles. Fresh deionized water enters the testing cell every morning, undergoes degassing, and receives a measured volume of wetting agent. The table below details calibration parameters across four common liquid bath systems used for receiving inspection of polyolefins per ISO 1183-1 and ASTM D792.
| Fluid Chemistry | Nominal Density at 23 °C | Thermal Drift Rate | Surface Tension | Degas Stability Window |
|---|---|---|---|---|
| Degassed Deionized Water | 0.99754 g/cm³ | 0.00021 g/cm³/°C | 72.0 mN/m | 4.0 Hours |
| Water with 0.1% Wetting Agent | 0.99762 g/cm³ | 0.00022 g/cm³/°C | 29.5 mN/m | 3.5 Hours |
| Reagent Grade Isopropanol | 0.78310 g/cm³ | 0.00084 g/cm³/°C | 21.7 mN/m | 1.0 Hours |
| Anhydrous Ethanol | 0.78730 g/cm³ | 0.00083 g/cm³/°C | 22.1 mN/m | 0.75 Hours |
Minor density fluctuations between laboratory certificates and receiving logs frequently reflect water wetting differences rather than compounding variations.

Sinker
Weighing polymers with specific gravity below 1.000 in water requires a ballast body of known volume and mass to pull the specimen beneath the liquid surface. The sinker, typically fabricated from polished Austenitic 316 stainless steel, nickel-plated brass, or high-purity copper, mounts beneath a specimen basket suspended from the balance draft hook. Balance calibration must account for the tare weight of this assembly submerged to an unvarying liquid depth.
Mechanical interaction between the test specimen and the sinker cage represents a frequent source of human error. The polyethylene sample, whether cut from compression-molded plaques or tested as whole raw pellets, must remain completely immersed without contacting the beaker walls or resting against trapped air beneath the sinker base.
Dual Weighing Coupled Equations
Execution of ASTM D792 Method A requires three distinct balance determinations to resolve specimen density when using an auxiliary sinker in water. The technician first records the mass of the dry specimen in air. Next, the technician records the apparent mass of the sinker assembly alone suspended in the liquid bath.
Finally, the technician secures the polymer specimen into the submerged basket alongside the sinker and records the coupled submerged mass.
The mathematical reduction eliminates the absolute mass of the sinker assembly by subtraction, isolating polymer buoyant displacement through the coupled expression:
Density = (Mass in Air × Fluid Density) / (Mass in Air + Apparent Sinker Mass – Coupled Submerged Mass)
The following sequence governs incoming lot verification on analytical balances equipped with density determination kits:
- Instrument Thermal Stabilization requires thirty minutes of continuous electrical power and chamber door closure until internal drift falls below 0.05 mg.
- Electronic Internal Calibration executes an automatic routine utilizing certified internal class E2 reference weights before zeroing the tare hooks.
- Wire Submergence Zeroing establishes the baseline tare with the fine suspension hook immersed exactly three centimeters into the degassed fluid.
- Dry Mass Recording captures specimen weight in air across three successive stability indications to within 0.1 mg precision.
- Submerged Cage Loading seats the polymer firmly inside the underwater basket, confirming zero bubble adhesion across specimen edges.
- Coupled Buoyancy Determination documents the final immersed equilibrium mass precisely ten seconds after fluid surface motion settles.
Consider a practical verification scenario conducted on an incoming lot of cross-linkable high-density polyethylene targeted for pressure pipe extrusion. Take a 40-tonne lot arriving by bulk railcar where the supplier datasheet specifies a base resin density of 0.9440 g/cm³ at 23.0 °C. Ambient laboratory conditions register exactly 23.0 °C, fixing degassed pure water density at 0.99754 g/cm³ according to standard international physical tables.
The receiving inspector records dry specimen mass in air at 2.4512 g. The submerged stainless steel sinker and wire cage balance at an apparent mass of 14.8210 g. Securing the high-density polyethylene piece inside the underwater cage yields a coupled submerged mass of 14.6782 g.
Substituting these values into the hydrostatic formulation isolates the displacement denominator: 2.4512 g plus 14.8210 g minus 14.6782 g yields a net liquid displacement mass of 2.5940 g. Dividing 2.4512 g by 2.5940 g and multiplying by the water density of 0.99754 g/cm³ delivers a tested density of 0.9426 g/cm³.
The receiving result shows a negative deviation of 0.0014 g/cm³ against the vendor certificate. This discrepancy represents an unacceptable divergence for pipe-grade resin, indicating possible contamination with hexene-copolymer film scrap or excessive masterbatch let-down upstream. Sinker volume wear or surface oxidation can distort the true displaced volume over years of daily service, leaving open whether the error originates within the stainless ballast calibration or within the resin reactor batch itself.

Variance
Discrepancies in hydrostatic balance calibration do not occur in isolation from the polymer morphology itself. Polyethylene is a semi-crystalline thermoplastic whose final crystalline fraction depends on the thermal conditioning of the sample. Testing virgin pellets straight from an incoming gaylord yields inconsistent density values because each pellet experiences rapid, uneven quenching at the underwater pelletizer die face.
Standardized incoming inspection demands sample preparation according to ISO 17855-2 or ASTM D4703 Procedure C. Technicians press raw pellets into void-free sheets between polished ferrotype plates at 180 °C, hold the melt under 10 MPa of hydraulic clamping pressure for five minutes, and cool the platen assembly at a controlled linear rate of 15.0 °C per minute. Quenching plaques under cold tap water locks in amorphous polymer chains, producing an apparent density depression up to 0.0045 g/cm³ relative to slow-cooled material.
A specimen cooled at 40 °C per minute exhibits lower crystalline volume fraction than an identical lot cooled under standard 15 °C per minute thermal protocols.

Compression Plaque Cooling Rates and Annealing
Crystalline lamellae in high-density polyethylene continue to organize long after the polymer reaches room temperature. Annealing test specimens in an oven at 100 °C for one hour followed by slow cooling relieves internal frozen-in molding stresses and eliminates amorphous density depressions. When high-volume receiving docks cut corners by punching testing discs directly out of raw ellipsoidal pellets, gas bubbles trapped in pellet shrinkage voids ruin the reading.
Pellet voids develop when the outer skin of the molten plastic droplet solidifies inside the water ring while the molten interior shrinks during crystallization. These internal vacuum bubbles contribute zero mass but displace substantial liquid volume during hydrostatic weighing. Shaving pellets with a surgical razor reveals internal cavitation in roughly eight out of ten virgin injection-grade pellets.
Whose Reference Standard Arbitrates Sinker Density Discrepancies?
Calibration disputes between resin suppliers and compounding plants escalate when both entities operate verified analytical balances yet record irreconcilable density logs. Resolving these impasses requires external primary standards traceable to National Metrology Institutes. Solid reference standards consisting of certified polished quartz or single-crystal silicon spheres provide absolute mass-to-volume calibration baselines without meniscus or thermal-drift ambiguities.
Silicon immersion spheres certified to six decimal places isolate balance mechanism non-linearity from fluid conditioning errors. Suspending a certified 10.000 cm³ silicon sphere into the testing vessel confirms the absolute fluid density of the bath in real time, bypassing reliance on published temperature-density look-up charts. The table below illustrates the impact of systematic testing errors across polyethylene grade acceptance gates.
| Error Source | Physical Magnitude | Observed Density Drift | Impact on Acceptance Gate |
|---|---|---|---|
| Water Bath Thermal Drift | +1.5 °C shift | -0.00035 g/cm³ | Shifts MDPE resin into LLDPE category |
| Wire Meniscus Pinning | 0.50 mm wire diameter | +0.00090 g/cm³ | Rejects premium pipe grade for high density |
| Specimen Microvoids | 100 µm void in 1g pellet | -0.00052 g/cm³ | Triggers false positive claim for resin blending |
| Air Bubble Adhesion | Two 0.4 mm bubbles | -0.00018 g/cm³ | Fails narrow-spec rotomolding qualification |
| Plaque Quench Rate | 40 °C/min cooling rate | -0.00380 g/cm³ | Masks excessive regrind content in delivery |
Dispute resolution clauses in commercial supply agreements frequently specify that ASTM D792 displacement readings derived from compression-molded plaques prepared under ASTM D4703 Procedure C supersede all direct pellet testing logs when determining technical conformity.


Intake
Receiving docks operate under tight logistical constraints where railcars, bulk tankers, and twenty-foot sea containers demand rapid unloading to avoid demurrage penalties. Demurrage costs at marine terminals run hundreds of dollars daily per container, while rail carriers impose escalating storage fees on pressurized hopper cars held beyond 48 hours. Rapid receiving tests must preserve analytical rigor while delivering conclusive pass-fail outcomes within ninety minutes of delivery check-in, particularly given how strictly customs classifications penalize fractional discrepancies.
A systematic incoming inspection program separates procedural field tests from laboratory arbitration routines. Testing three distinct samples harvested from top, middle, and discharge valves of incoming bulk tankers protects processors from silo contamination. When off-spec low-density material mixes into a high-density compounding silo, purging thousands of kilograms of cross-contaminated polymer drains factory margins and halts automated conversion lines for entire shifts.

Harmonized Tariff Schedule Boundary Verification
Cross-border resin shipments cross customs thresholds defined by strict density divisions under international trade codes. Harmonized Tariff Schedule Chapter 39 separates primary forms of polyethylene across a critical dividing line at specific gravity 0.940. Polymers testing below 0.940 fall under tariff heading 3901.10, whereas polymers measuring 0.940 and above enter under heading 3901.20.
Customs import duties, anti-dumping duties, and trade remedies diverge significantly across this boundary.
An importer clearing a 200-tonne shipment of medium-density polyethylene declared at 0.939 g/cm³ faces immediate seizure, reclassification, and back-duty penalties if customs laboratory hydrostatic testing returns 0.9405 g/cm³ due to water bath temperature drift or sample void inclusions. Importers mitigate this exposure by maintaining calibration logs with certified bath thermometer calibration traceable to international standards, providing an audited evidentiary trail defending declared entry classifications.
Receiving Dock Protocol for Silo Unloading
Incoming verification workflows must isolate mechanical scale error, bath fluid error, and thermal specimen history before warehouse personnel connect pneumatic transfer hoses. The analytical balance requires daily calibration checks using stainless steel reference weights across its operating span, accompanied by monthly verification of suspension wire integrity. Damaged wires displaying kinks or surface oxidation must face immediate retirement, as rough wire surfaces collect liquid meniscus droplets that ruin tare calculations.
The primary receiving failure modes observed across plastic processing docks share recognizable physical root causes:
- Liquid Bath Evaporation causes progressive concentration of surfactants and rapid cooling of volatile organic media.
- Uncorrected Sinker Buoyancy Drift stems from mechanical wear, corrosion, or pitting on submerged ballast weights.
- Trapped Air Inclusions originate from unannealed pellet shrinkage cavities and incomplete sample surface wetting.
- Thermal Stratification In Beakers arises from static fluid standing in draft chambers without mechanical circulation or insulation.
- Suspension Meniscus Pinning develops when dirty, bent, or oversized wires breach the air-liquid boundary layer.
A balance showing drift during tare verification indicates dirty suspension hooks or contaminated fluid baths.