Tooling Surface Polish Impact on First Article Inspection Accuracy
Uncalibrated optical scans on mirror-polished plastic introduce up to fifteen micrometers of false elevations, ruining First Article Inspection accuracy.


Refraction
Optical metrology tools encounter severe signal corruption when inspecting molded polymer parts produced in highly polished steel cavities. High specular reflectivity on glossy plastic surfaces blinds non-contact sensors, creating point cloud noise that masks true dimensional boundaries. When a First Article Inspection (FAI) report relies on structured blue light, white light, or laser line scanning, shiny surfaces distort edge detection and radius calculation.

Non Contact Measurement Glare Distortions
Blue light structured sensors rely on predictable diffuse scatter across plastic geometry to calculate surface point clouds. High-gloss finishes produced by Society of the Plastics Industry (SPI) A-1, A-2, or A-3 diamond polishes reflect light directly back into sensor cameras at specular angles. This saturation causes sensor clipping, where metrology software interprets saturated pixel blocks as missing data or false geometry elevations, causing laser line triangulation to fail on mirror-like surfaces.
Mirror polished optical parts produce up to fifteen micrometers of artificial profile elevation under blue light scanning when ambient reflection filters remain uncalibrated.
Optical cross-talk between opposing specular surfaces exaggerates internal rib widths and wall thickness readings. Refracted light bounces inside semi-transparent or clear resins, such as polycarbonate and polymethyl methacrylate, generating secondary surface reflections. Software algorithms mistake these internal reflection returns for physical back-wall boundaries, underreporting wall thickness on critical First Article documentation.

Probe Skidding on Polished Cavity Walls
Physical touch-trigger styli operating on low-friction optical plastic faces experience vector drift during high-angle approaches. When a coordinate measuring machine (CMM) ruby stylus contacts a steep, ultra-smooth wall at an angle oblique to the normal vector, the stylus tip skids across the boundary before registering the mechanical deflection trigger. This micro-slippage delays signal registration, recording a false coordinates displacement.
Tangential slippage becomes pronounced on draft angles below one degree where contact vectors run nearly parallel to stylus movement. The resulting point matrix systematically inflates internal cavity dimensions and shrinks external part profile measurements.
- Specular Saturation Overexposes camera charge-coupled devices, truncating sharp feature edges in the point cloud.
- Phantom Point Clouds Creates secondary reflections inside clear resins that registered point cloud algorithms interpret as physical geometry.
- Stylus Tangential Slip Forces CMM touch probes to slide along smooth steep angles, recording late triggering signals.
- Edge Inflation Blurs sharp internal radii through optical cross-talk across adjacent mirrored surfaces.
Executing first article inspections on mirror-polished components with uncorrected optical scanning parameters generates systematic false-negative dimensional rejections, forcing unneeded tool modifications that permanently ruin tool steel geometry.
Grain
Standardized surface classifications categorized by industry standards dictate both visual clarity and micro-topography in steel cavities. Surface roughness directly alters how molten resin flows, packs, cools, and releases from the tool. Profilometry metrics such as Ra (arithmetic average roughness) and Rz (maximum height of profile) govern physical part release kinetics, which fundamentally shape the part’s final unconstrained dimensions.
Surface Finish Standard Specifications
Society classification codes range from diamond-polished grade A-1 down to shot-blasted grade D-3, establishing direct control over peak-to-valley roughness values. Higher polish grades remove microscopic machining peaks left by CNC end mills or Electrical Discharge Machining (EDM) electrodes, lowering boundary friction and ejection force.
| SPI Finish Grade | Finishing Method | Target Ra (µm) | Target Rz (µm) | CMM Measurement Impact |
|---|---|---|---|---|
| A-1 | Grade 3 Diamond Paste | 0.012 to 0.025 | 0.05 to 0.10 | High specular noise; optical scanning requires polarization or dulling spray |
| A-2 | Grade 6 Diamond Paste | 0.025 to 0.050 | 0.10 to 0.20 | Moderate specular reflection; vector skidding on touch probes above 45 degrees |
| A-3 | Grade 15 Diamond Paste | 0.050 to 0.100 | 0.20 to 0.40 | Low specular noise; baseline optical profile captures accurately |
| B-1 | 600 Grit Paper | 0.100 to 0.200 | 0.40 to 0.80 | Optimal optical scanning surface; diffuse light scatter without blinding |
| B-3 | 320 Grit Paper | 0.280 to 0.400 | 1.10 to 1.60 | Excellent tactile probe grip; negligible stylus tip slippage |
| C-2 | 600 Stone | 0.400 to 0.800 | 1.60 to 3.20 | Diffuse scattering ideal for blue light metrology; high wall drag |
| D-2 | 240 Glass Bead Sandblast | 0.800 to 1.600 | 3.20 to 6.30 | High surface variance; point cloud filter smoothing must be widened |

What Surface Polish Level Minimizes Ejection Stress?
Tool steel roughness dictates the mechanical force needed to clear plastic parts during the mold opening sequence. Highly polished SPI A-2 surfaces reduce boundary shear, allowing parts to slide off cores smoothly. However, ultra-polished SPI A-1 surfaces sometimes create localized vacuum seals against flat thermoplastic faces, increasing the required ejection pull and causing mechanical distortion on thin-walled features during ejection.
Rougher EDM finishes like SPI C-1 or D-2 provide micro-mechanical interlocking between the shrinking polymer and the cavity wall. Ejector pins push against this resistance, inducing flexural stress, post-mold bowing, and pin push-through marks that distort surface scans. When CMM systems scan parts damaged by high ejection drag, recorded dimensions reflect post-mold mechanical deformation rather than core tooling geometry.
Hand-polishing cavity surfaces to a mirror state strips away localized steel, altering final part geometry beyond nominal print boundaries and introducing unexpected FAI dimension shifts.

Friction
Resistance along the mold interface during injection and cooling phases governs melt flow kinetics and local pressure distribution. Smooth steel walls allow hydraulic packing pressure to transmit efficiently into deep ribs and distant walls. Rough cavity textures increase wall shear, dropping effective pack pressure and altering local volumetric shrinkage across the molding.

Wall Shear and Packing Density Stack Up
Viscous resin sliding across stone-finished metal generates localized shear heating and pressure loss, retarding resin melt flow. When cavity walls exhibit high micro-roughness, frozen layer formation begins earlier along the flow path. The core melt channels contract, restricting the passage of holding pressure during the gate-seal phase of the molding cycle.
Higher mold wall smoothness lowers the required pack pressure needed to achieve uniform volumetric density across long flow lengths.
Reduced pack transmission results in higher volumetric shrinkage in regions distal to the gate. First Article parts measured from roughly finished tools frequently measure below nominal drawing dimensions in end-of-fill zones. Increasing holding pressure to correct distal sink marks on high-friction tools risks over-packing areas near the gate, creating internal stress and warpage that corrupts FAI flatness measurements.
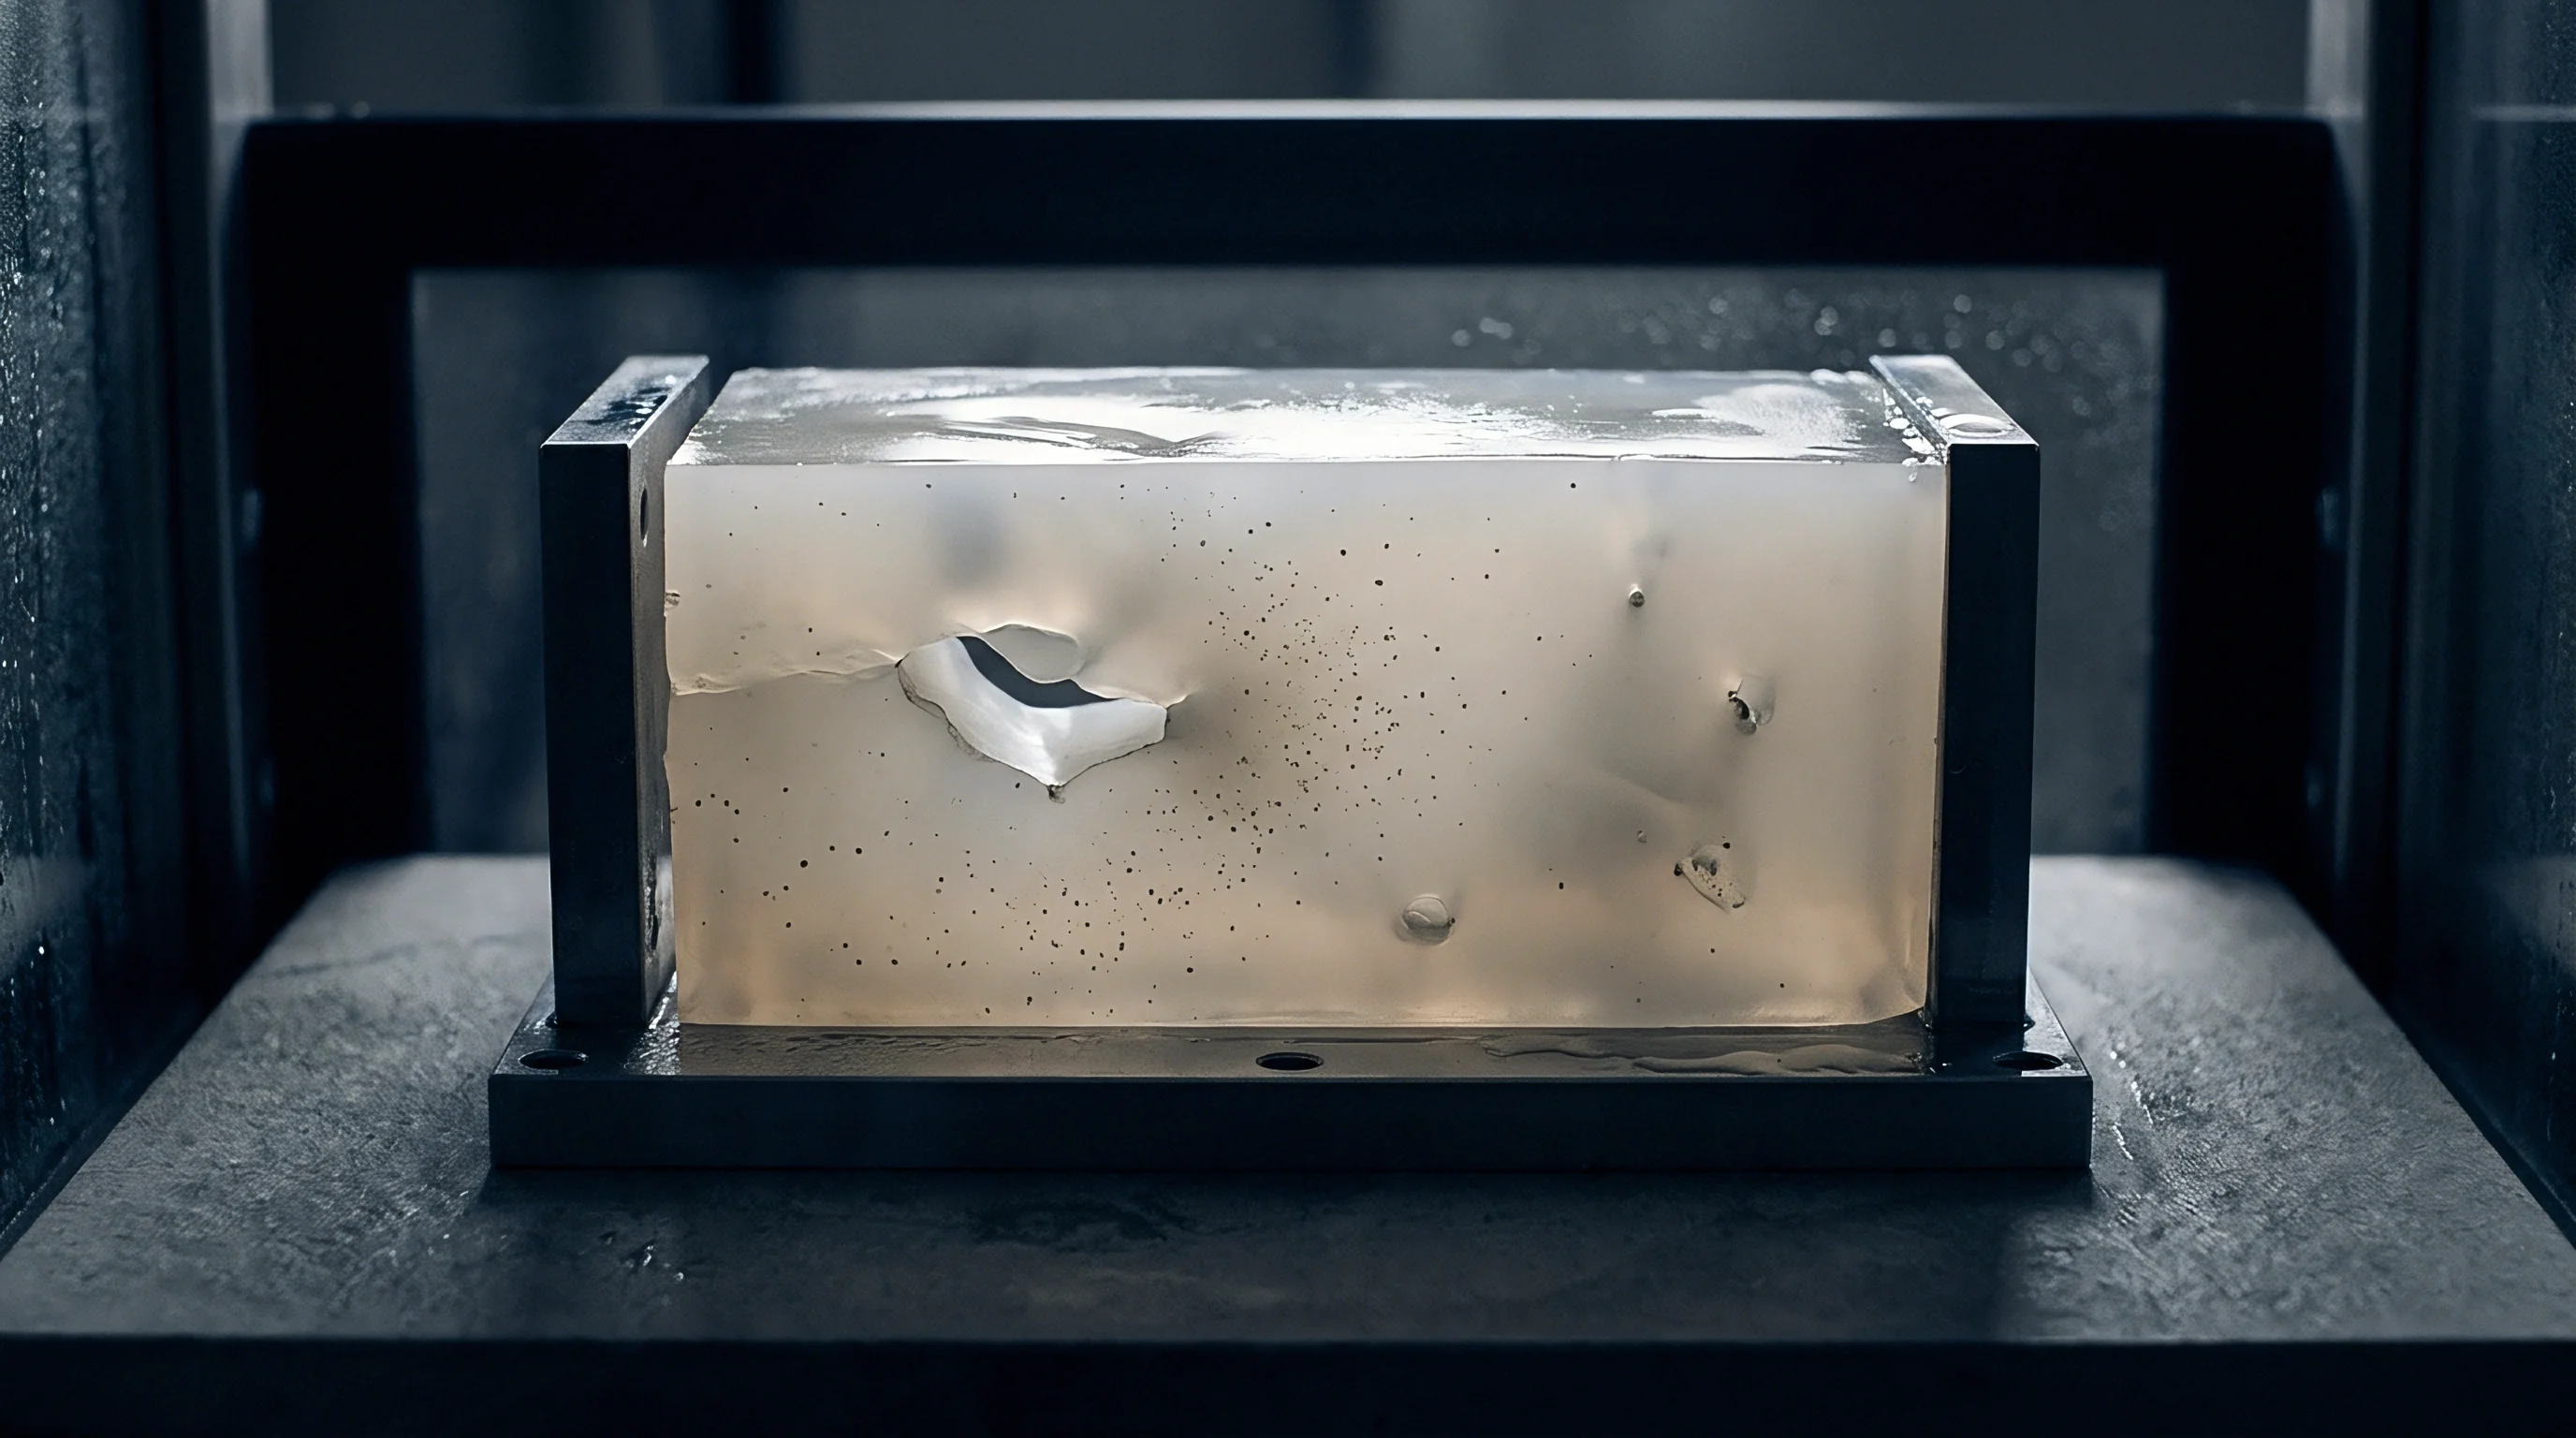
Volumetric Shrinkage Deviations under Polish Variance
Differences in local tool smoothness create unequal thermal contact resistance between cooling polymer and chilled metal boundaries. Smooth SPI A-1 polish creates continuous physical contact, increasing cooling rates and accelerating thermal freeze. Rougher surfaces trap microscopic air pockets within micro-grooves, reducing heat flux through the cavity walls.
Because cooling rates vary with cavity finish and thermal load, polymer crystalline structures grow unevenly, shifting linear shrink rates away from resin datasheet nominals. A semi-crystalline material like polypropylene or polyoxymethylene shrinks substantially more when held against a hot, roughly finished cavity surface than when cooled rapidly against mirror-polished steel.
- Melt Pressure Retention Preserves hydraulic pressure further down the flow path when cavity wall resistance remains minimal.
- Cooling Contact Resistance Alters heat transfer rates because smooth steel interfaces maintain closer physical contact with freezing polymer shells.
- Part Release Force Influences residual stress concentrations induced when ejector pins drive against semi-rigid core ribs.
- Volumetric Shrink Rate Shifts post-mold thermal contraction dimensions based on peak holding pressure achieved before gate seal.
Higher cavity polish allows lower injection pressure to fill thin sections while maintaining tight dimensional tolerances on First Article samples.


Probe
Coordinate measurement equipment and tactile arms rely on calibrated contact force to establish feature locations on plastic components. Physical probing systems register points by deflecting a sensitive internal spring mechanism when the stylus contacts the part surface. The accuracy of this physical touch depends heavily on the localized surface roughness and mechanical stiffness of the molded resin.

Tactile Stylus Deflection Mechanics
Measuring soft engineering thermoplastic moldings with diamond-tipped or ruby-tipped arms requires strict management of triggering forces. Soft polymers like thermoplastic polyurethane or unreinforced polypropylene yield elastically under CMM stylus contact forces ranging from 0.05 N to 0.20 N. On smooth SPI A-2 surfaces, force application remains predictable and perpendicular to the face.
On rougher SPI C-3 or EDM surfaces, stylus tips catch on surface micro-peaks. The applied force concentrates on localized microscopic asperities, depressing the plastic surface before the sensor registers a trigger. This micro-indentation records a false internal position, systematically deflecting measured coordinates by up to twelve micrometers on flexible resins.
DIN 16742 mandates that First Article dimensional compliance evaluations account for measuring force compliance when inspecting soft thermoplastic components.
Surface Developer Coating Thickness Bias
Applying dulling sprays to eliminate reflective glare during optical scanning introduces an artificial material layer that alters physical part boundaries. Spraying titanium dioxide or sublimating cyclododecane powders creates a diffuse matte layer that eliminates specular blinding. However, uneven spray application corrupts First Article dimensional fidelity if left uncalibrated.
Aerosol coatings deposit layers ranging from two to fifteen micrometers thick depending on operator technique and spray distance, skewing thin wall checks. In tight-tolerance applications governed by DIN 16742 Grade TG4, where tolerances sit within plus or minus thirty micrometers, an uncalibrated coating layer consumes half of the total allowable engineering tolerance band.
- Clean the molded thermoplastic part with isopropyl alcohol to remove mold release agents and finger oils.
- Shake the titanium dioxide or cyclododecane aerosol spray canister for two minutes at ambient room temperature.
- Apply a single continuous pass at a distance of thirty centimeters to deposit a uniform dusting layer.
- Verify coating uniformity using a calibrated step-gage coupon placed alongside the First Article part.
- Subtract the verified three-micrometer mean spray coating thickness from all optical point cloud vector measurements before generating the FAI report.
Incorporating ISO 10360-8 clause five into inspection agreements forces metrology labs to prove that anti-glare coatings do not exceed agreed tolerance bands during non-contact FAI reporting.


Discharge
Releasing tooling to full production after First Article Inspection demands complete alignment between cavity prep, drawing dimensions, and metrology offset files. Toolmakers adjust steel dimensions based on FAI dimensional trends. If measurement errors stemming from surface finish glare or probe skidding are mistaken for steel errors, toolmakers adjust correct cavities and permanently ruin tool alignment.

Toolroom Refinishing Costs and Dimensional Drift
Polishing out cutter marks or altering finish levels after initial T1 sampling removes metal and directly expands internal cavity dimensions. Transitioning a tool cavity from an SPI B-2 finish down to an SPI A-2 mirror polish removes between five and twelve micrometers of tool steel from cavity surfaces, depending on toolmaker technique and initial tool hardness.
| Initial Steel State | Target SPI Finish | Steel Depth Removed (µm) | Cavity Dimensional Change (µm) | Labor Hours per Cavity |
|---|---|---|---|---|
| EDM (240 Grain) | SPI A-2 (Diamond) | 8.0 to 15.0 | +16.0 to +30.0 (Internal) | 12 to 18 |
| SPI B-2 (Paper) | SPI A-2 (Diamond) | 3.0 to 6.0 | +6.0 to +12.0 (Internal) | 6 to 10 |
| SPI B-3 (Paper) | SPI B-1 (Paper) | 1.5 to 3.0 | +3.0 to +6.0 (Internal) | 3 to 5 |
| SPI A-3 (Diamond) | SPI A-1 (Diamond) | 1.0 to 2.5 | +2.0 to +5.0 (Internal) | 8 to 14 |
Manual polishing on complex three-dimensional contours rarely removes steel uniformly. Recesses and inside radii receive less abrasive pressure than prominent corners and flat land areas. Hand polishing an inspected tool alters geometry unevenly, creating localized wall thickness variations that invalidate original CMM programming paths.
Polishing a hardened tool cavity to fix surface defects removes metal and permanently shifts critical part dimensions.

Landed Cavity Sign off Protocol
Qualification dossiers bind the toolmaker, molder, and procurement practice to a single verified reference geometry. First Article approval must confirm both surface finish compliance and dimensional accuracy under identical process settings. Modifying tool surface polish to meet aesthetic requirements after completing dimensional FAI invalidates the entire metrology sign-off package.
Changes in surface polish alter cavity release drag, pack transmission, and shrinkage behavior. A part verified under an SPI B-2 surface state will exhibit distinct volumetric shrinkage metrics once polished to an SPI A-1 state. Precision tool sign-offs require re-running First Article Inspection protocols whenever steel surface polish changes by more than two SPI classification grades.
Optical metrology software continues to evolve toward compensating for surface reflectivity without requiring physical dulling sprays during inspection.