Nondestructive Computed Tomography Volumetric Void Acceptance Criteria for Heavy Polymer Sections
Computed tomography volumetric void acceptance requires zoning heavy polymer walls by stress field, setting pore limits below 0.1% in tensile skins.

Beam
Micro-focus X-ray tubes need sufficient photon output to maintain an adequate signal-to-noise ratio when penetrating thick polymer sections. When engineering thermoplastics exceed 15 mm and reach 50 mm to 100 mm in structural components, radiological behavior diverges sharply from thin-wall radiography. Low-density hydrocarbon matrices attenuate radiation predominantly through Compton scattering rather than photoelectric absorption.
At acceleration voltages between 130 kV and 225 kV, low atomic number polymers like unreinforced polyoxymethylene, polyamide, and ultra-high-molecular-weight polyethylene permit high transmission, but extended path lengths generate substantial scatter-induced background fog across flat-panel detectors.
As the ratio of scattered to primary unscattered photons reaching the detector array climbs with increasing section thickness, contrast drops across the central axis of the moulding. Micro-focus focal spots between 5 µm and 40 µm deliver high geometric sharpness, but operating tubes at the elevated power levels needed for thick walls enlarges the electron beam footprint on the reflection target. This focal spot blooming blurs features throughout the reconstruction volume.
Resolving a 0.2 mm void within an 80 mm diameter polyoxymethylene stock cylinder requires balancing target power, projection integration time, and the total projection count across a 360-degree rotation.
X-ray acceleration voltages at 180 kV with 0.5 mm copper pre-filtration achieve a signal-to-noise ratio above 12 to 1 across 65 mm unreinforced polyamide sections without detector saturation.

Penetration Mechanics through Thick Wall Polymers
Industrial computed tomography relies on Beer-Lambert attenuation models adapted for polychromatic spectra. When an unfiltered polychromatic X-ray beam traverses heavy polymer sections, outer material layers absorb lower-energy photons first, shifting the transmitted spectrum toward higher average energies. This shift generates beam hardening artifacts in reconstructed voxel volumes, appearing as artificial density spikes near outer boundaries and false, void-like attenuation dips in the thermal core of the moulding.
Hardware pre-filtration mitigates these spectral distortions. Inserting a 0.2 mm to 1.0 mm brass, copper, or aluminium filter plate at the tube exit window strips out low-energy photons before they enter the part. Software correction routines then apply polynomial linearization curves calibrated against stepped wedges machined from the exact production resin grade.
Without physical filtration and matching linearization, reconstructed gray values at the center of an 80 mm section can drop by up to 14 percent relative to the perimeter, causing automated segmentation tools to register false-positive voids.
| Polymer Chemistry and Reinforcement | Wall Thickness (mm) | Tube Voltage (kV) and Current (µA) | Hardware Pre-Filter | Voxel Resolution (µm) | Reconstruction Dynamic Range |
|---|---|---|---|---|---|
| Unfilled POM (Acetal Copolymer) | 40.0 | 140 kV / 120 µA | 0.25 mm Cu | 22.5 | 16-bit unsigned integer |
| PA66 with 30% Short Glass Fiber (GF30) | 35.0 | 180 kV / 100 µA | 0.50 mm Cu | 18.0 | 16-bit unsigned integer |
| PEEK (Polyetheretherketone Unfilled) | 60.0 | 160 kV / 140 µA | 0.50 mm Al | 31.0 | 16-bit unsigned integer |
| UHMWPE Compression Moulded Slab | 90.0 | 130 kV / 180 µA | None (Raw) | 48.0 | 16-bit unsigned integer |
| PPS with 40% Glass and Mineral Fill | 25.0 | 210 kV / 90 µA | 0.75 mm Cu | 14.5 | 16-bit unsigned integer |
Photon Starvation across High Atomic Number Fillers
Reinforcing additives change transmission profiles substantially. Glass fibers, mineral compounds, barium sulfate markers, and flame retardants containing phosphorus or bromine introduce higher-Z elements into the low-density hydrocarbon matrix. The silicon and calcium content in glass fiber doubles the linear attenuation coefficient relative to neat polyamide.
In sections containing 30 to 50 percent short glass fibers by weight, high attenuation triggers localized photon starvation across long projection paths.
Starvation artifacts manifest as dark bands and severe streaks between high-attenuation features in the reconstruction field, obscuring micro-porosity or mimicking planar cracks across structural ribs. Overcoming starvation in mineral-filled mouldings requires raising tube potentials to 225 kV or 300 kV alongside high-dynamic-range flat-panel detectors. Scan parameters are calculated from path lengths through the CAD model envelope, adjusting projection integration times from 33 milliseconds to 1000 milliseconds with frame averaging to suppress detector readout noise.

Does Density Calibration Prevent False Defect Rejection?
Reference phantom scans calibrate reconstructed gray values directly to physical density. Homogeneous calibration cylinders machined from the production resin batch provide baseline attenuation benchmarks. Scanning these reference phantoms alongside the component compensates for tube output drift and detector temperature swings during long production runs; if target degradation alters raw gray values, the algorithm scales voxel intensities back to the phantom baseline.
This calibration sets dependable thresholds for distinguishing true shrinkage cavities from low-density amorphous zones. Semi-crystalline polymers like polyoxymethylene and high-density polyethylene exhibit 2 to 4 percent density differentials between rapid-quenched skins and slow-cooled spherulitic cores. Uncalibrated thresholding often misidentifies these lower-density cores as micro-porosity clusters.
Multi-material calibration phantoms tie detection thresholds to absolute physical density rather than floating relative gradients by indexing void baselines to air attenuation levels.
Inadequate attenuation calibration produces false-positive rejections on good parts, or allows sub-surface voids to pass inspection and cause fatigue failures in service.
Pore
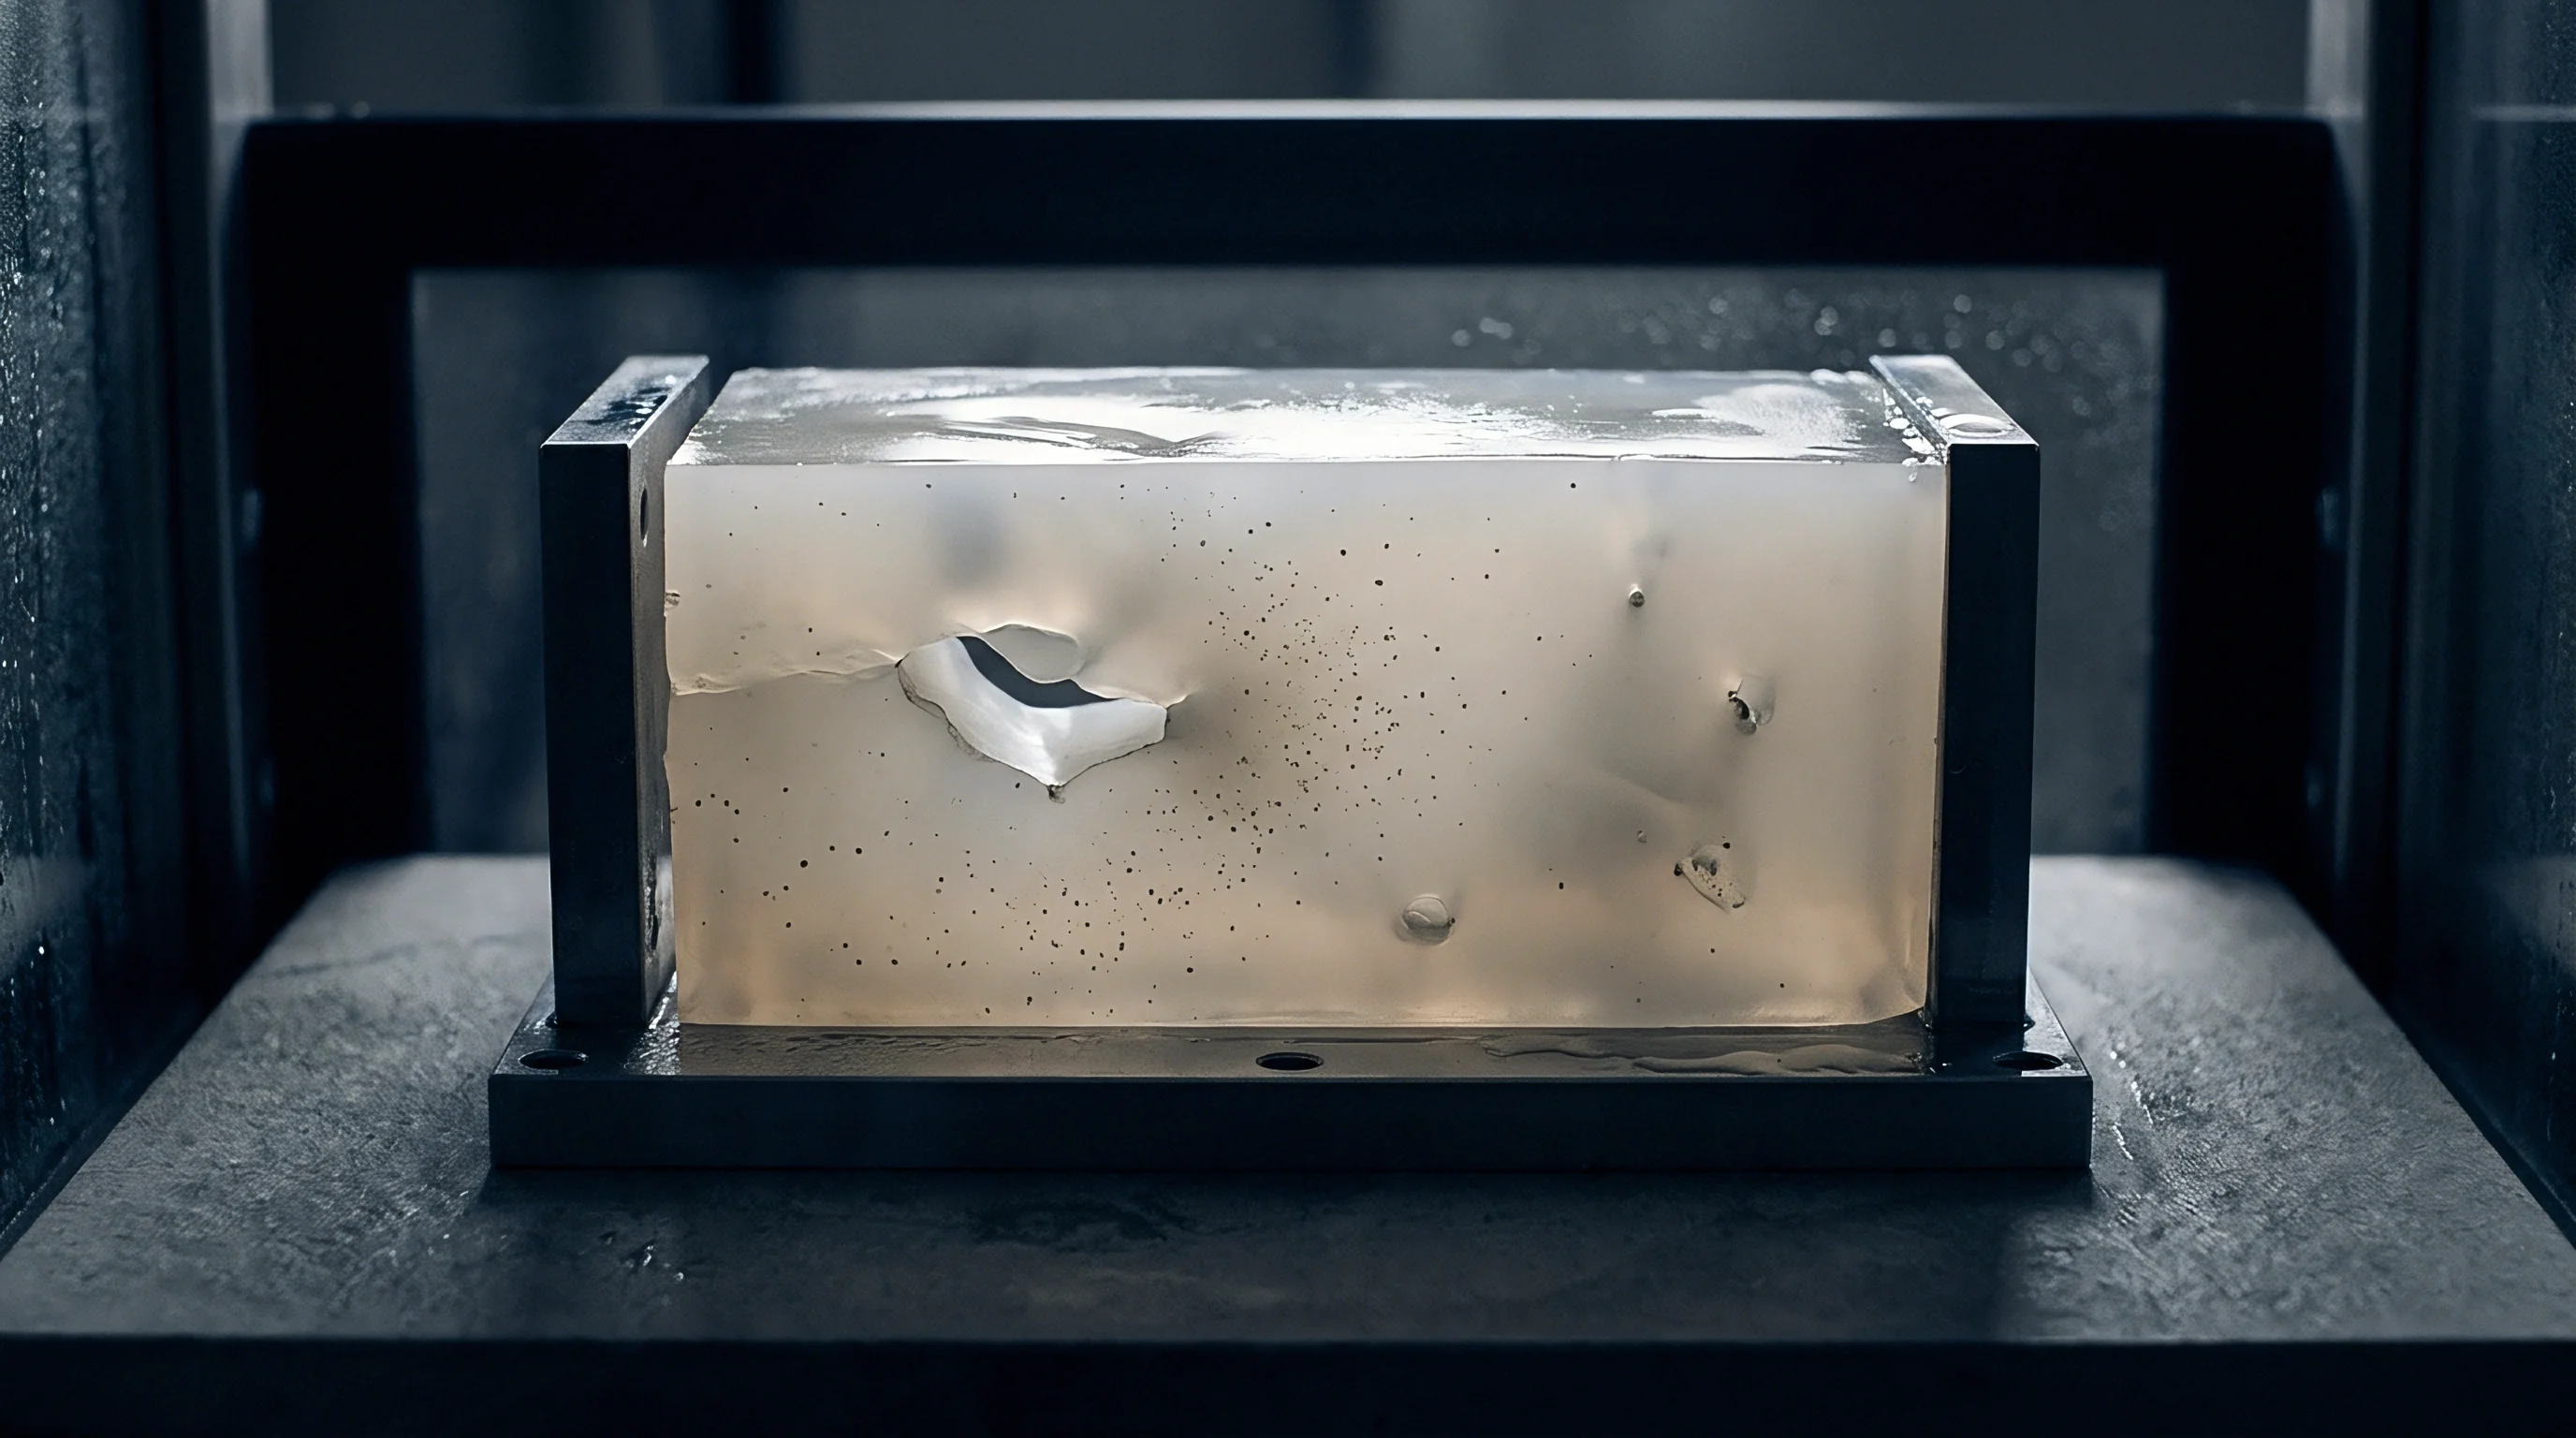
Internal voids in heavy plastic mouldings follow distinct morphologies governed by melt thermodynamics and rheology. In wall sections between 12 mm and 75 mm, heat dissipation is throttled by low thermal conductivity, typically between 0.15 and 0.35 W/m·K. Rapid freezing against chilled cavity walls builds a rigid skin while the core remains molten, and subsequent cooling of the insulated core induces a 10 to 20 percent volumetric contraction in semi-crystalline matrices.
If holding pressure decays before core freeze occurs, the shrinking melt pulls outward from the thermal center, generating negative hydrostatic pressure in the liquid interior. Once tensile stresses exceed the cohesive strength of the melt, the material cavitates into vacuum voids marked by rough, dendritic surfaces, distinct from the smooth spherical walls characteristic of gas bubbles.
Void generation mechanisms exhibit specific physical characteristics in heavy industrial mouldings:
- Vacuum Thermal Shrinkage Voids form at the geometric and thermal centers of heavy wall cross-sections, exhibiting rough interior walls, irregular branching shapes, and zero internal gas pressure at room temperature.
- Moisture Vapor Pores appear as smooth, highly spherical bubbles distributed randomly throughout both thin and thick wall regions, caused by hygroscopic resin degradation in the plasticizing barrel when processing un-dried polyamide, polycarbonate, or polyester resins.
- Volatile Thermal Degradation Voids cluster near high-shear gate regions or dead spots within the hot runner manifold, containing trapped gaseous hydrocarbons and exhibiting charred or discolored boundary linings under optical cross-sectioning.
- Trapped Air Pockets locate along converging melt-front weld lines or dead-end ribs without adequate cavity venting, presenting smooth spherical or compressed elliptical profiles with distinct boundary interfaces against the frozen matrix.
| Porosity Category | Sphericity Coefficient | Location in Cross-Section | Internal Atmosphere | Stress Concentration Factor (Kt) |
|---|---|---|---|---|
| Core Vacuum Shrinkage Cavity | 0.30 to 0.65 | Thermal center, neutral axis | Vacuum (< 0.05 bar) | 2.8 to 4.2 (High notch effect) |
| Hydrolytic / Moisture Bubble | 0.85 to 0.99 | Dispersed throughout wall | Steam / Gas residue | 1.5 to 2.0 (Mild notch effect) |
| Entrapped Cavity Air Pocket | 0.60 to 0.85 | Flow ends, weld interfaces | Compressed air / Volatiles | 2.0 to 2.9 (Moderate notch) |
| Degradation Off-Gas Void | 0.70 to 0.92 | Near gate, flow transitions | Gaseous volatiles | 2.1 to 3.0 (Moderate notch) |

Thermal Core Shrinkage versus Volatile Entrapment
Separating shrinkage voids from gas pores dictates whether tooling or process parameters require correction. Shrinkage cavities stem from volumetric contraction under thermal tension, while gas pores are formed by bubbles expanding against melt pressure. In CT data, sphericity calculations quantify this distinction by taking the ratio between the surface area of an equal-volume sphere and the actual measured pore surface area.
Sphericity metrics near 1.0 indicate gas bubbles, whereas values below 0.60 point to irregular vacuum shrinkage cavities. When analysis reveals sphericity values above 0.88 distributed uniformly across a 40 mm wall, high dew points in the drying hopper are generally responsible rather than pack profiles. Conversely, an irregular void with a sphericity of 0.42 located at the junction of a 20 mm wall and a 15 mm gusset indicates premature gate freeze or insufficient packing transmission through the runners.

Geometric Metrics Defining Cavity Severity
Assessing volumetric defects requires geometric parameters beyond simple diameters. Planar radiography collapses 3D features into 2D projections, obscuring depth and surface topography. High-resolution computed tomography yields complete 3D meshes for segmented cavities, allowing evaluation across three core metrics: Equivalent Spherical Diameter (ESD), surface-to-volume ratio, and bounding box aspect ratio.
Equivalent Spherical Diameter corresponds to the diameter of a sphere possessing the same volume as the extracted void. The surface-to-volume ratio highlights sharp boundary notches that concentrate stress under cyclic fatigue. For instance, a void with an ESD of 1.5 mm and a surface-to-volume ratio of 8.5 mm⁻¹ presents a substantially greater risk of crack initiation than a smooth spherical void with an ESD of 2.0 mm and a ratio of 3.0 mm⁻¹.
Boundary Distances across Structural Wall Envelopes
Defect location within the wall cross-section governs mechanical knock-down factors. The ligament distance ~ the shortest clearance from a void edge to the nearest exterior surface ~ determines residual load capacity. Voids in the outer 15 to 20 percent of wall thickness fall directly inside high-stress bending envelopes where applied tensile stresses peak.
A void positioned along the neutral axis experiences minimal tension under pure bending, acting essentially as an unloaded core cell. That same cavity located 1.0 mm beneath the tensile skin reduces structural integrity, initiating brittle surface fractures well below yield strength. Defect severity is evaluated by mapping void coordinates against the principal stress tensor from finite element analysis rather than measuring gross volumetric loss in isolation.
Voids residing along the neutral axis do not compromise bending stiffness when adequate solid ligament envelopes remain intact across both outer surfaces.


Voxel
Spatial discretization converts continuous physical attenuation into a structured grid of volumetric pixels. In computed tomography, spatial resolution is governed by geometric magnification ~ the ratio of source-to-detector distance over source-to-object distance. Scanning an entire 200 mm polymer component requires positioning the part farther from the focal spot, which increases the reconstructed voxel edge length from 10 µm up to 100 µm or more.
The partial volume effect occurs when a voxel spans both solid polymer and a void, yielding a gray value averaged between the two attenuation levels. When a 50 µm micro-void falls within an 80 µm voxel grid, it cannot fill a complete voxel, suppressing the local gray value without establishing a distinct air peak. Reliable defect resolution requires the smallest defect dimension to span at least 3.0 to 4.5 voxels along its narrowest axis.
Accurate defect volume determination requires a minimum spatial sampling ratio of four voxels across the smallest critical pore diameter.
Surface Determination and Gradient Thresholding
Segmenting void boundaries requires edge-detection routines applied to the reconstructed histogram. The standard ISO 50% threshold places boundaries halfway between the air background and polymer peaks. Although computationally light, ISO 50% fails in heavy sections where beam hardening, scatter fog, and localized density variations skew global histogram distributions.
Local gradient thresholding calculates boundary positions dynamically by tracking voxel intensity gradients along surface-normal rays and placing the interface at the maximum inflection point. Iterative local surface determination models sub-volume background noise to establish localized thresholds for individual surface voxels, preventing false expansion of core voids while preserving micro-porosity boundaries near dense outer skins.
Rigorous computed tomography metrology demands strict controls across acquisition and processing parameters:
- Spatial Calibration Verification using traceable ruby or silicon nitride sphere ball-bars according to VDI/VDE 2630 Part 1.3 to confirm volumetric scaling accuracy.
- Rotational Axis Center Alignment correcting mechanical wobble and detector tilt down to sub-pixel offsets before back-projection reconstruction.
- Dynamic Beam Hardening Correction applying dual-energy polynomial calibrations matched to specific polymer filler loadings.
- Adaptive Local Segmentation setting independent gradient thresholds across varying wall thicknesses to eliminate partial volume edge expansion.
Uncertainty Bounds in Submillimeter Porosity Extraction
Measurement uncertainty in volumetric defect sizing originates from hardware drift, voxel discretization, and segmentation thresholds. VDI/VDE 2630 Part 1.2 and Part 1.4 define methods for evaluating length and probing errors in CT metrology. In heavy polymer sections, thermal expansion introduces notable error if cabinet temperatures fluctuate during multi-hour scans; engineering plastics exhibit thermal expansion coefficients between 40 and 150 × 10⁻⁶ K⁻¹, roughly an order of magnitude higher than metals.
A 3°C rise in cabinet temperature expands a 100 mm polyoxymethylene part by 0.036 mm, distorting back-projection geometry. Environmental controls must maintain internal air temperatures at 20°C ± 0.5°C. For void volumes below 0.1 mm³, a 2 percent shift in segmentation threshold creates an uncertainty band of ±18 percent. Quantifying this variance requires validating CT volumes against serial cross-sectioning and optical microscopy on sacrificial validation parts.

Is Multi Scale Voxel Resolution Economically Feasible?
Scanning complete heavy sections at sub-micron voxel sizes takes days per unit, making full-envelope inspection cost-prohibitive. Multi-scale region-of-interest scanning addresses this limitation. A coarse overview scan captures the entire 150 mm component at 75 µm resolution in 12 minutes, establishing overall geometry and identifying porosity clusters for software to flag.
The system then executes a high-magnification sub-scan by positioning the targeted 20 mm thermal node close to the tube and applying region-of-interest algorithms to handle truncated projections. This secondary scan resolves void morphology at 12 µm voxel resolution in 8 minutes, keeping total machine occupancy under 25 minutes while capturing sub-voxel structural detail. Balancing overview scan speeds against targeted high-resolution windows maintains throughput without missing critical defect limits.
Standard factory CT scans cannot resolve 20-micrometer voids throughout 100-millimeter solid stock, where focal spot blooming and noise floors mask porosity below half a millimeter.

Grading
Acceptance criteria for internal voiding must balance structural safety factors against injection moulding constraints. Demanding absolute zero porosity in a 40 mm thick polyoxymethylene hub creates an unachievable production window, leading to excessive scrap and unnecessary tooling revisions. Functional grading protocols instead link allowable void sizes, volume fractions, and spatial layouts directly to operational stress distributions.
Standards such as ASTM E1441, ASTM E1570, DIN EN ISO 5579, and DIN EN 16016 standardize CT acquisition and image evaluation, but they establish procedural baselines rather than polymer-specific acceptance thresholds. Sourcing specifications must state numerical limits for void dimensions, total volume percentages, nearest-neighbor spacing, and remaining ligament thickness relative to the part envelope.
DIN EN ISO 5579 classification tables mandate precise documentation of radiation quality, detector unsharpness, and spatial voxel resolution before any volumetric grading standard applies to a production lot.

Stress Field Zonation and Defect Criticality
Stress distributions across structural mouldings are rarely uniform. Partitioning components into functional quality zones based on finite element models aligns non-destructive testing thresholds with local mechanical risk.
Three functional zones define the standard grading framework for heavy section mouldings:
- Zone A Critical Skin Envelopes encompass the outer 15 to 25 percent of the nominal wall thickness, high-stress structural radii, functional O-ring sealing faces, and dynamic bearing interfaces where tensile and shear stresses peak.
- Zone B Structural Shear Webs represent intermediate wall sections, load-bearing internal gussets, and force-transfer cores operating at moderate stress levels between 30 and 70 percent of polymer tensile yield strength.
- Zone C Neutral Thermal Nodes define low-stress geometric centers, deep bosses, and thermal mass cores operating at nominal stresses below 30 percent of yield where bending stresses drop toward zero.
| Quality Zone | Max Single Void Volume (mm³) | Max Equivalent Spherical Diameter (mm) | Max Total Porosity (% Volume) | Min Nearest Neighbor Distance | Min Ligament to Outer Surface |
|---|---|---|---|---|---|
| Zone A (Critical Skin / Seal) | 0.05 mm³ | 0.45 mm | 0.10 % | 5.0 × Void Diameter | 3.0 mm (or 100% solid) |
| Zone B (Structural Web / Rib) | 0.50 mm³ | 1.00 mm | 1.00 % | 2.5 × Void Diameter | 1.5 mm |
| Zone C (Neutral Core / Node) | 8.00 mm³ | 2.50 mm | 3.50 % | 1.0 × Void Diameter | 0.8 mm |

Volumetric Acceptance Limits across Thick Sections
Explicit volumetric limits prevent quality disputes between buyers and moulders. Capping maximum single void volume constrains local stress concentrations; in Zone A, where high surface tensile stresses dictate fatigue performance, individual voids are capped at 0.05 mm³ (an Equivalent Spherical Diameter of 0.45 mm), with any larger defect triggering rejection.
Total volumetric porosity limits cumulative density loss within a defined sub-volume. In heavy Zone C cores, overall porosity up to 3.5 percent is generally tolerable provided voids stay dispersed. If voids cluster, their stress fields interact to create continuous fracture paths.
Nearest-neighbor spacing rules require that the ligament between adjacent pores exceeds their combined average diameter, preventing crack coalescence under cyclic service loads.
Production lot evaluation follows a structured numerical sequence to verify compliance against CT acceptance criteria:
- Reconstructed Volume Alignment against the nominal CAD reference coordinate system using a 3-2-1 geometric feature datum alignment.
- Coordinate Zonation Masking applying CAD-based volume bounding envelopes to separate raw voxels into Zone A, Zone B, and Zone C inspection spaces.
- Automated Defect Segmentation extracting all connected air-density voxel clusters exceeding a base noise threshold of 8 connected voxels.
- Spatial Parameter Extraction computing Equivalent Spherical Diameter, individual volume, bounding surface-to-volume ratio, and nearest-neighbor distances for every segmented cavity.
- Zoned Threshold Comparison flagging any defect exceeding single-volume limits, total zone percentage porosity, or surface ligament minimums.

Tensile Ligament Reduction Calculations
Evaluating defect criticality requires quantifying projected cross-sectional area loss normal to primary tensile vectors. Calculating projected pore areas across high-stress planes provides structural derating values: as voiding reduces solid cross-sectional area, engineering stress across the remaining ligament increases in proportion.
Consider a 50 mm wide by 30 mm thick tensile tie bar moulded from PA66-GF30 with an ultimate tensile strength of 175 MPa. The solid cross-sectional area is 1500 mm², rated for a 130 kN tensile load at a nominal safety factor of 2.01. Computed tomography identifies three Zone B shrinkage cavities across a single 2 mm longitudinal plane: Void 1 has an ESD of 2.2 mm (projected area 3.8 mm²), Void 2 has an ESD of 1.8 mm (projected area 2.5 mm²), and Void 3 has an ESD of 1.4 mm (projected area 1.5 mm²), yielding a combined projected loss of 7.8 mm².
While the remaining load-bearing area of 1492.2 mm² represents only a 0.52 percent reduction, applying Neuber’s stress concentration rule to the dendritic void contours yields a local notch factor Kt of 3.2. Localized stress under the 130 kN load rises from 87.1 MPa to 278.7 MPa, surpassing the 175 MPa ultimate strength of the matrix. Micro-cracking initiates at the cavity perimeter and spreads along the glass fiber interfaces under cyclic stress.
Volumetric acceptance criteria must therefore account for local notch factors alongside raw cross-sectional area loss.
Under ASTM E1570 Section 8.4, contractual acceptance requires explicit specification of the minimum detectable defect size alongside the spatial calibration record, invalidating any rejection that relies on uncalibrated voxel intensity gradients.

Exposure
Integrating volumetric computed tomography into production quality workflows involves distinct capital and piece-price trade-offs. Industrial CT systems require capital outlays from 350,000 to over 1,200,000 USD depending on acceleration voltage, flat-panel detector specifications, and granite stage stability. Operating a 225 kV system carries an industry machine rate of 180 to 320 USD per hour, adding directly to component landed cost.
Full 100 percent CT screening is rarely economical for standard parts running on 90-second injection cycles, since a 20-minute scan and 16-bit reconstruction adds 60 to 100 USD in inspection overhead per unit. Quality plans use computed tomography selectively: high-resolution scans for tooling qualification, initial mould sign-off, and process window verification, paired with statistical sampling on serial production runs.

Scanning Duration against Piece Price Economics
Inspection time depends on wall thickness, polymer attenuation, and target voxel resolution. Penetrating an 80 mm mineral-filled polyoxymethylene part demands longer detector integration times and higher frame averaging to maintain acceptable noise floors. Overall cycle time encompasses part mounting, rotational exposure over 1000 to 2400 projection angles, volume reconstruction, automated defect segmentation, and reporting.
Inspection overhead scales non-linearly with thickness: scanning a 15 mm unreinforced polyamide part takes 4 minutes and adds 15 USD, whereas a 75 mm reinforced part requires 35 minutes and adds over 110 USD. Procurement contracts must specify whether CT inspection applies as a First Article Inspection requirement, a statistical lot audit, or continuous 100 percent screening on critical components.
| Component Scale and Material | Wall Thickness Range (mm) | Typical Scan Time (Minutes) | Inspection Cost per Part (USD) | Recommended Inspection Frequency |
|---|---|---|---|---|
| Small Structural Gear (PA66-GF30) | 8.0 to 15.0 mm | 4.5 min | $16.00 to $24.00 | 100% Critical Batches / 1 per Shift |
| Medium Valve Body (POM Copolymer) | 15.0 to 35.0 mm | 12.0 min | $40.00 to $65.00 | First Article / 5 Parts per Lot |
| Heavy Flange Housing (PEEK Unfilled) | 35.0 to 60.0 mm | 22.0 min | $75.00 to $115.00 | First Article / Tooling Trial Only |
| Massive Solid Bushing (UHMWPE) | 60.0 to 110.0 mm | 45.0 min | $150.00 to $240.00 | 1 per Production Run / Qualification |
Lot Qualification and Tooling Signoff Thresholds
Tooling sign-off provides the strongest return on computed tomography investment. Conventional qualification relies on coordinate measuring machines and destructive cross-sectioning of isolated samples. CMM checks confirm cavity steel geometry against CAD nominals but provide no visibility into core shrinkage voiding, packing efficiency, or sub-surface weld line integrity.
Destructive sawing destroys the component, smears soft polymer across micro-voids, and yields only arbitrary planar views.
CT non-destructively digitizes internal and external geometries across all cavities in First Article batches. Scanning multi-cavity samples identifies cavity-to-cavity filling variations, runner freeze discrepancies, and localized thermal imbalances; if Cavity 4 exhibits 2.5 percent greater core voiding than Cavities 1 through 3, volumetric coordinates pinpoint the gate freeze issues requiring steel modifications prior to final sign-off.
Risk Allocation in Cross Border Tooling Contracts
Sourcing heavy polymer mouldings from offshore manufacturing partners introduces commercial exposure when internal quality standards remain undefined. Purchase orders that specify only visual cosmetic criteria and external tolerances leave buyers vulnerable if thick-walled components contain uninspected core cavities.
Supply agreements require unambiguous, enforceable volumetric void clauses. Contracts must reference the applicable CT acquisition standard, incorporate quality zonation drawings, specify maximum single void volumes and zone porosity percentages, and establish financial remedies if lot audits reveal non-compliant voiding. When processors shorten hold pressures or trim cooling cycles to accelerate output, the resulting internal cavities trigger automated rejection during incoming CT inspection, keeping the financial liability of cycle-time shortcuts with the moulder.
Whether future multi-material additive manufacturing of thick composite structures can match injection moulding cycle economics while remaining within standard industrial CT void grading boundaries remains an open challenge for high-volume hardware sourcing.