Noncontact Metrology Surface Phase Deconvolution for Transparent Polymer Optics under Variable Spatial Cutoffs
Deconvolving spatial phase errors across variable bandwidth cutoffs establishes precise surface topography data for injection moulded polymer optics.


Fringe
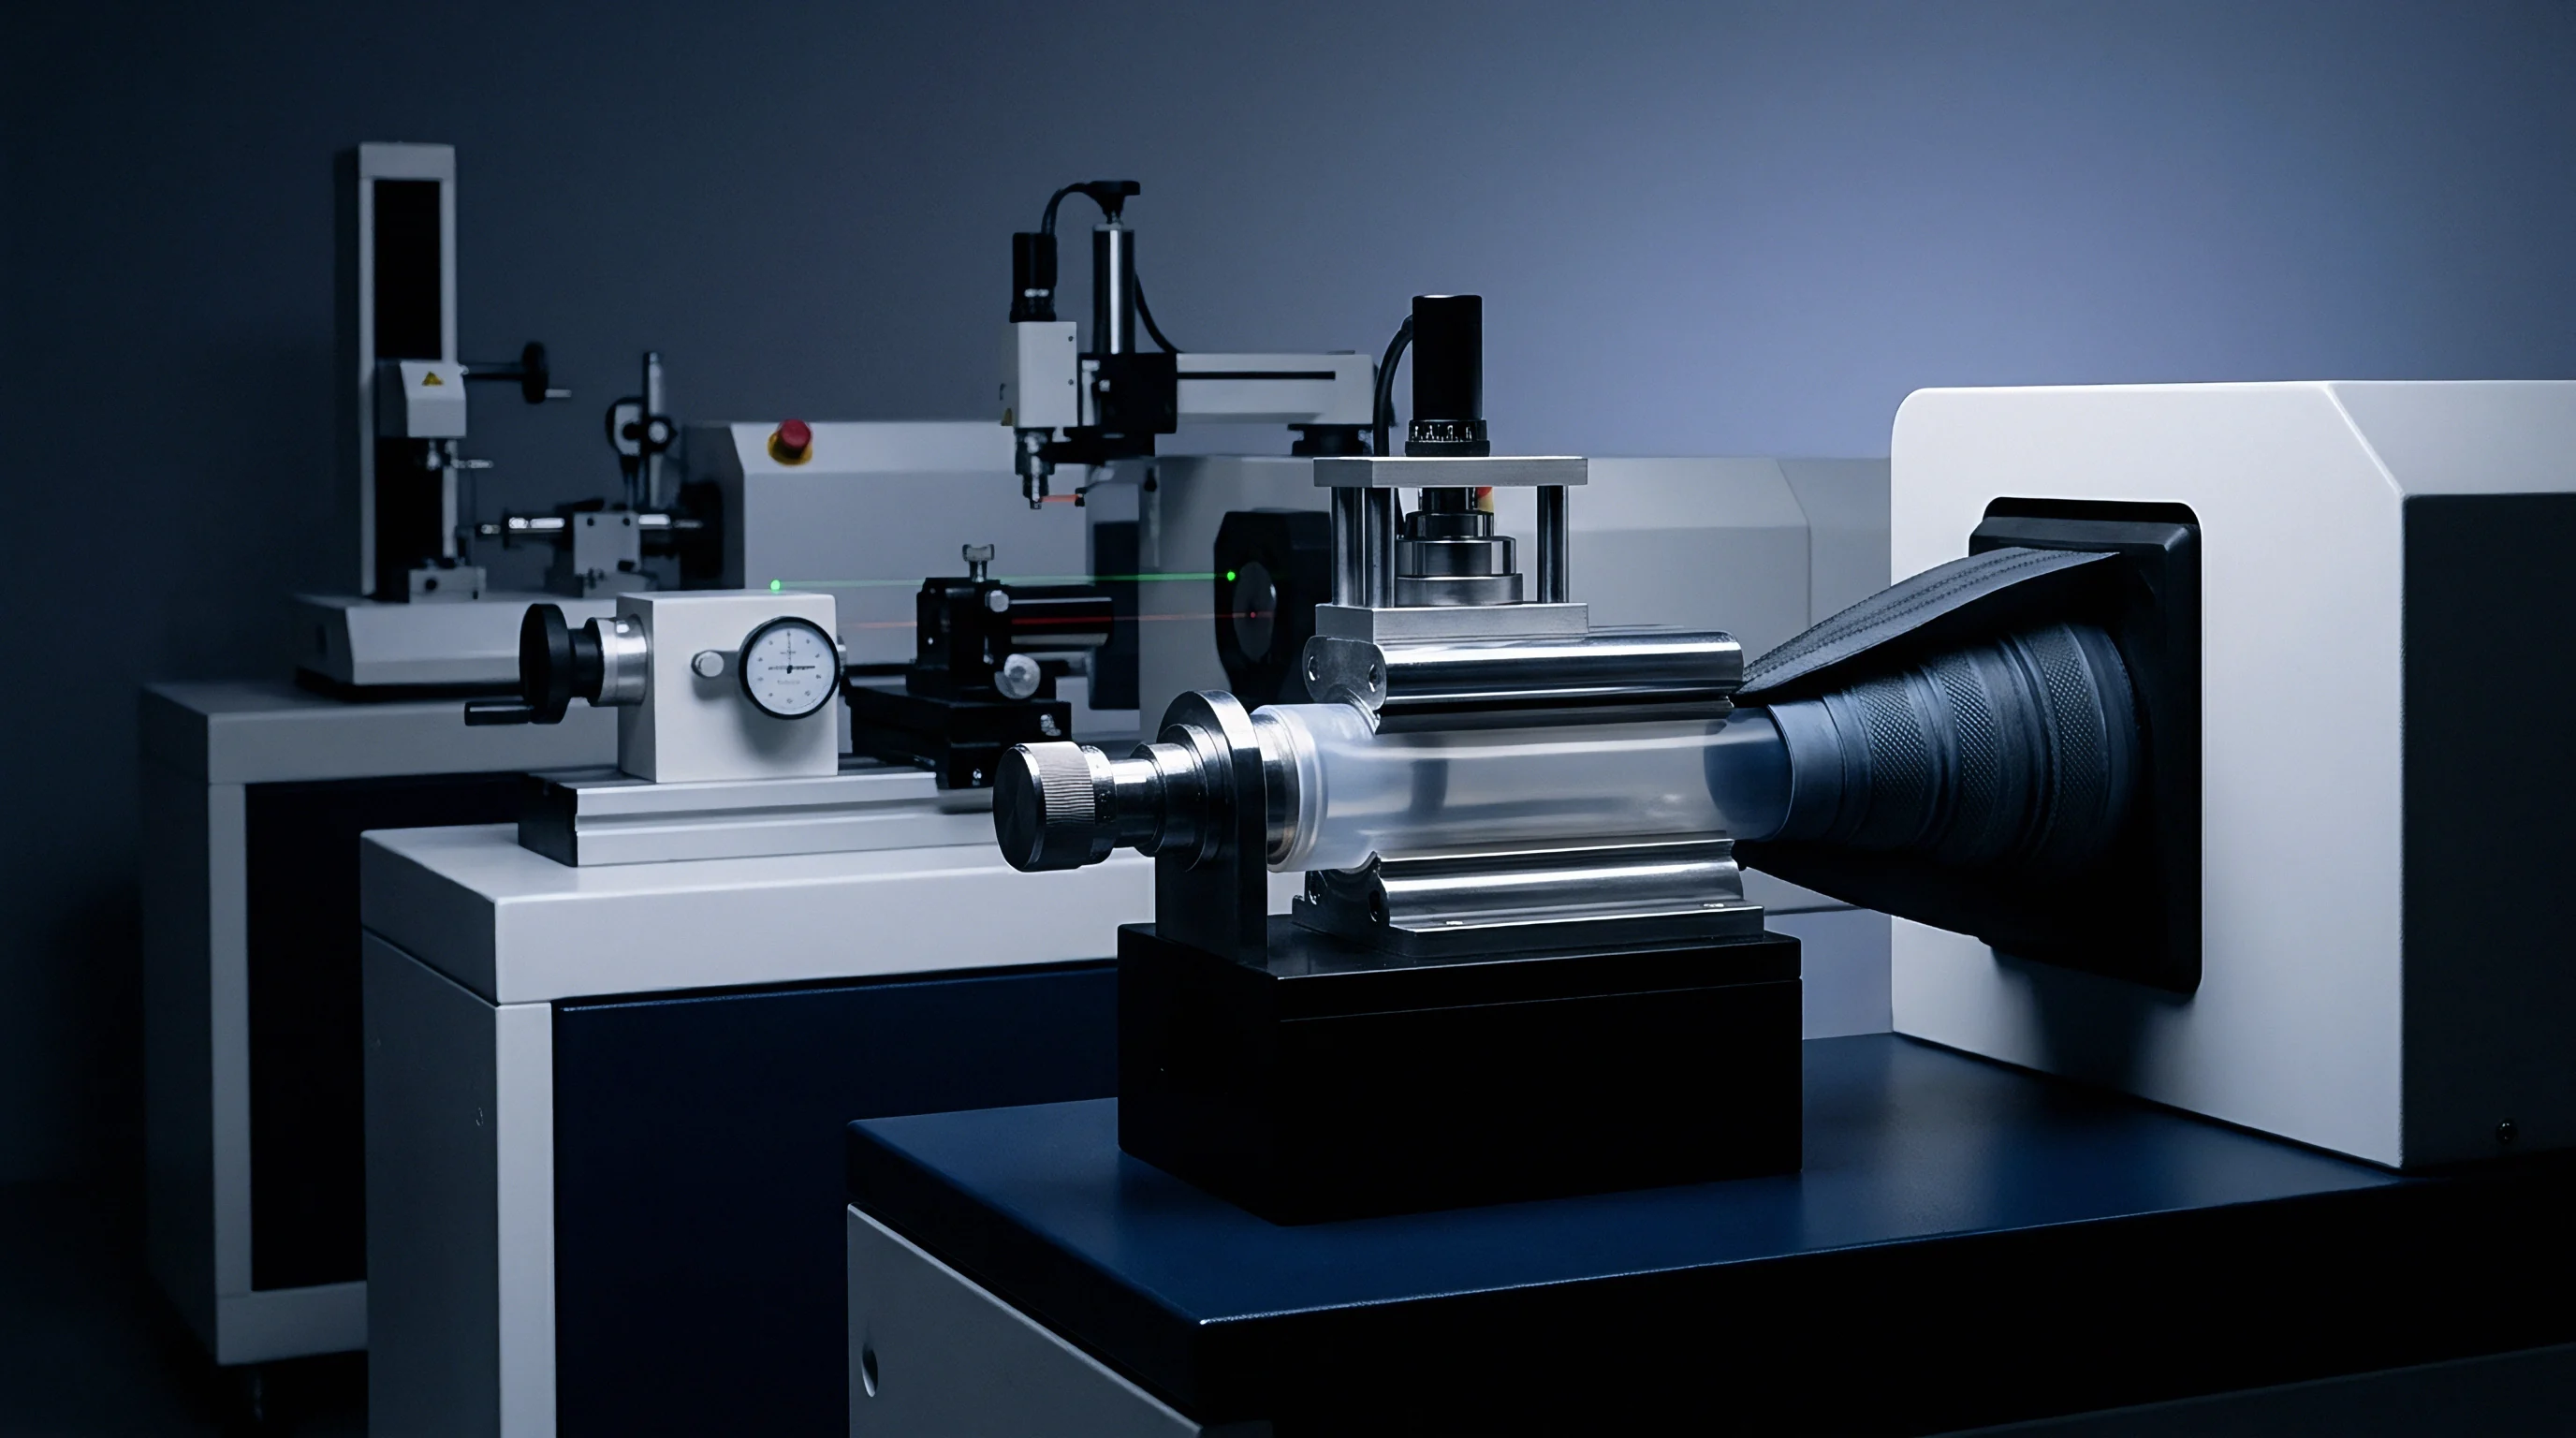
Noncontact optical metrology relies on coherent wave interference to reconstruct three-dimensional micro-topography across injection moulded optical components. When monochromatic or narrowband light reflects from a transparent polymer optic, the reflected wavefront interferes with a reference wavefront, generating sinusoidal intensity variations across the camera sensor pixel array. Capturing these interference signals across discrete phase shifts enables sub-nanometer height resolution along the optical axis of the component under test.
Optical phase maps shift instantly.

Phase Retrieval Mechanics
Surface height variations produce local optical path differences that map directly into intensity oscillations at the sensor plane. Standard phase-shifting interferometry records four or five sequential frames while shifting the reference mirror by known fraction-of-a-wavelength increments via a calibrated piezoelectric actuator. Calculating the spatial phase angle at each pixel location yields an unwrapped phase map, which converts to surface height using the central wavelength of the illumination source.
Sub-nanometer resolution demands rigid environmental stabilization.
Phase unwrapping algorithms resolve two-pi phase discontinuities that occur whenever surface height variations exceed half the light source wavelength. Steep local slopes on precision moulded lenses cause dense interference spatial frequencies that exceed the Nyquist sampling limit of the camera detector array. When spatial frequencies exceed two pixels per fringe period, phase unwrapping fails, creating phase jump artifacts that disguise genuine tool insert replica errors as measurement noise.
Phase shifting interferometry achieves 0.1 nanometer axial resolution when ambient thermal drift remains under 0.05 kelvin per hour.

Low Coherence Scanning Configurations
Broadband illumination limits spatial coherence length to resolve steep boundary slopes on curved optical elements. Coherence scanning interferometry translates the interference objective along the optical axis, tracking the peak of the low-coherence fringe envelope rather than relying solely on phase angle calculations. Scanning across the vertical envelope position allows noncontact measurement of high-curvature polymer optics without encountering spatial phase unwrapping ambiguities.
Sub-surface reflections from transparent optical polymers introduce secondary interference envelopes that distort primary surface detection. Materials such as cyclic olefin polymer and polymethyl methacrylate permit light penetration into the bulk substrate, generating back-surface reflections that overlap with front-surface interference patterns when lens center thickness drops below one hundred micrometers. Adjusting the spatial coherence length and numerical aperture of the optical system isolates the top surface envelope, suppressing optical crosstalk from internal stress fields or mold release residue.
- Position the optical component on the passive isolation table beneath the interferometric objective lens.
- Adjust illumination intensity and camera exposure time until fringe contrast exceeds eighty percent across the central aperture.
- Calibrate the piezoelectric stage drive voltage to match exactly ninety degrees of phase shift per frame step.
- Execute a five-step phase acquisition sequence to record raw intensity frames into memory.
- Apply a two-dimensional spatial phase unwrapping algorithm to convert fringe phase data into continuous height values.
Whether ultra-short wavelength blue LED illumination can eliminate diffraction limit ringing without exacerbating spatial phase ambiguity on high-slope convex polymer optics remains an open analytical question.


Filter
Deconvolution transforms raw height map arrays into true physical surface profiles by mathematically inverting instrument response function roll-offs. Every noncontact optical metrology tool acts as a spatial low-pass filter defined by its Instrument Transfer Function, which attenuates high spatial frequency topographical features near the optical diffraction limit. Applying spatial phase deconvolution restores attenuated high-frequency surface detail produced by ultra-precision diamond turning inserts.

Spatial Frequency Transfer Functions
Instrument Transfer Functions characterize spatial sensitivity limits across low, mid, and high spatial bandwidth domains. The spatial cutoff frequency defines the spatial frequency boundary where optical system response drops below fifty percent of its low-frequency baseline value. High spatial frequency components, such as single-point diamond turning tool feed lines spaced three micrometers apart, require high numerical aperture objectives to maintain unit transfer response.
Deconvolution restores high frequency surface details.
Measuring mid-spatial frequency ripple on injection moulded polymer optics requires precise determination of the transfer function roll-off curve. Instrument optical transfer characteristics depend on objective magnification, detector pixel pitch, and source spatial coherence. Uncompensated transfer roll-off causes systematic underestimation of root-mean-square surface roughness, masking mold tool chatter and single-point diamond turning feed marks that generate severe wide-angle scatter in imaging optics.
Low-pass spatial filtering before phase deconvolution prevents high-frequency noise amplification at the expense of blurring micro-trench edge boundaries.
Regularization in Phase Reconstruction
Ill-conditioned matrix inversions occur when high-frequency spatial noise dominates signal amplitudes near detector Nyquist boundaries. Direct matrix inversion creates mathematical instability. Inverse filtering amplifies camera detector shot noise, air turbulence ripple, and high-frequency vibrations into large numerical spikes in the reconstructed topography map.
Tikhonov regularization introduces a spatial damping parameter that stabilizes phase reconstruction by penalizing large high-frequency derivative gradients. Selecting an optimal regularization parameter balances spatial resolution restoration against noise amplification. Wiener filtering provides an alternative approach by incorporating the signal-to-noise ratio spectrum of the metrology system, weighting the inverse transfer function according to measured spatial noise power spectral densities.
| Algorithm Type | Computational Complexity | Noise Sensitivity | Spatial Frequency Recovery Band | Convergence Rate |
|---|---|---|---|---|
| Direct Matrix Inversion | Low | Extreme | Full Bandwidth | Immediate |
| Tikhonov Regularization | Moderate | Controlled | Low to Mid Frequencies | Single Pass |
| Wiener Deconvolution | Moderate | Optimized | Mid to High Frequencies | Single Pass |
| Richardson-Lucy Iteration | High | Low | Near Nyquist Limit | 15 to 50 Iterations |
- Spatial aliasing artifacts emerge when high-frequency tool chatter exceeds detector Nyquist limits, wrapping high spatial frequencies into false low-frequency waviness bands.
- Edge ringing phenomena appear along steep optical boundaries due to sharp spectral truncations during Fourier transform operations inside unwindowed deconvolution matrices.
- Noise spike amplification degrades root-mean-square roughness accuracy when regularizing parameters fall below critical signal-to-noise ratio thresholds.
- Phase unwrapping singularities generate localized height dislocations that distort surrounding topographical gradients following inverse transfer filtering.
Selecting spatial cutoffs below the tool feed rate suppresses diamond turning harmonics while preserving genuine structural mold replication defects.
Shrinkage
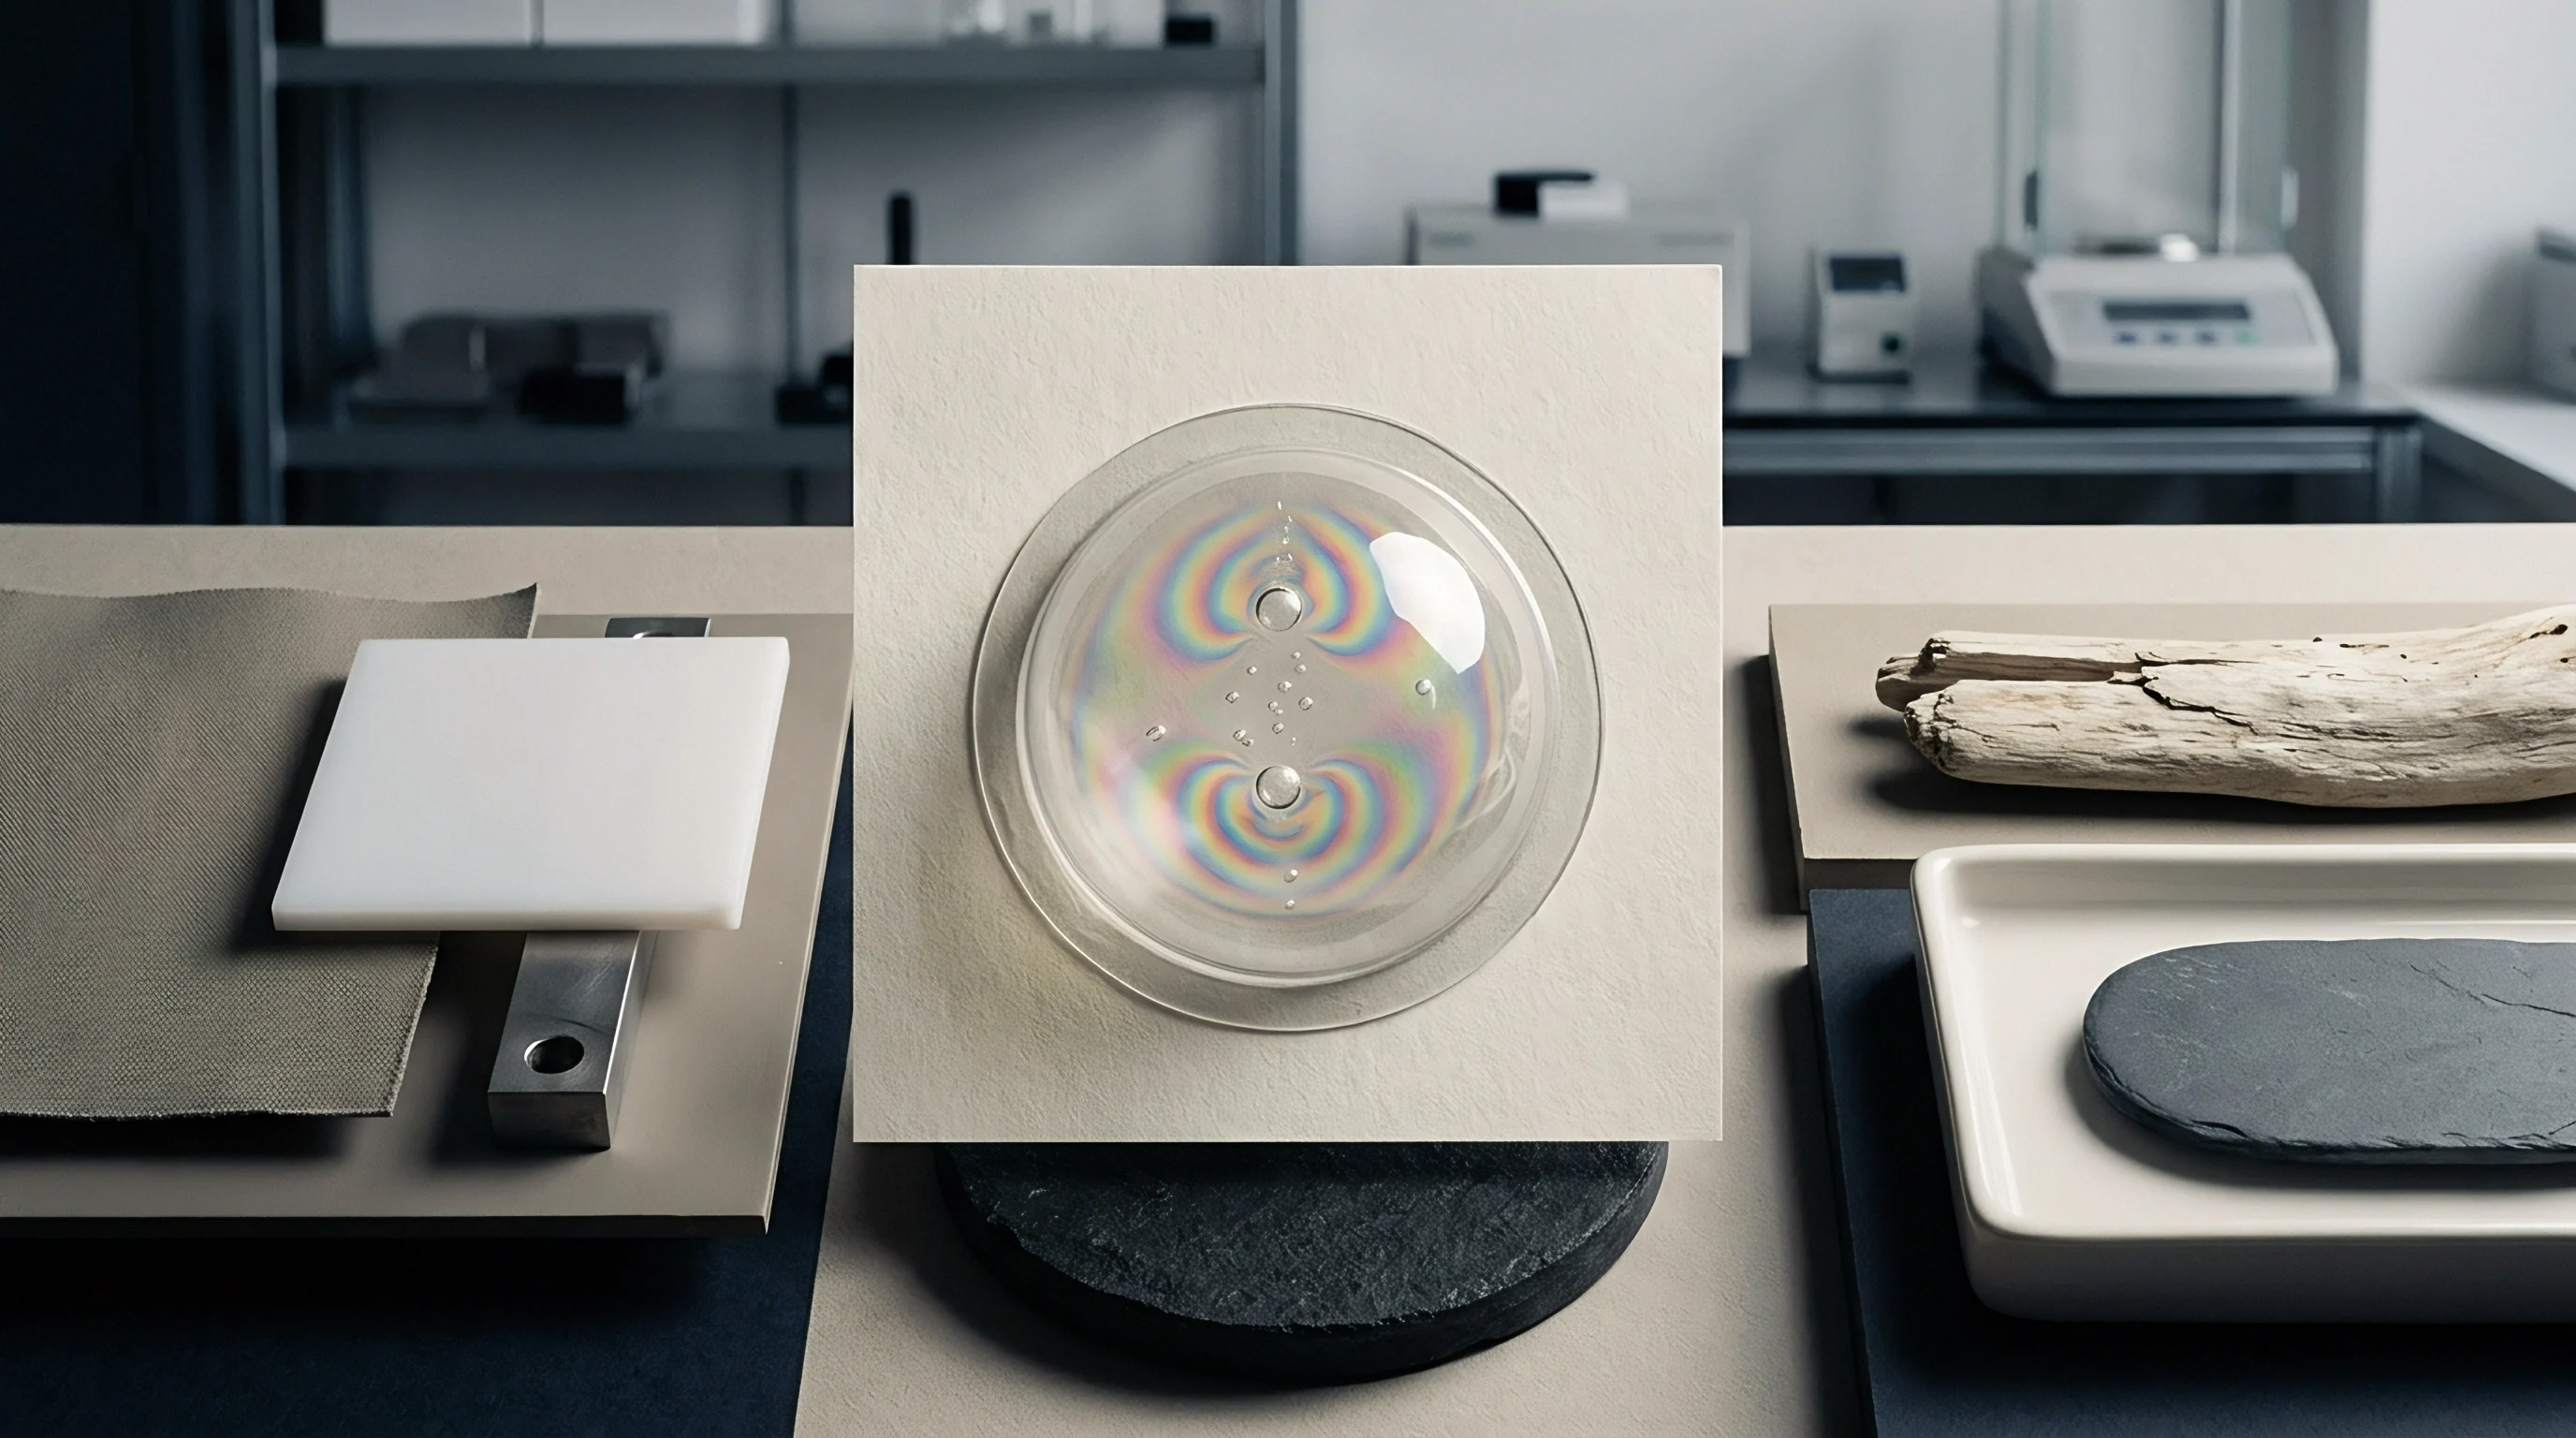
Polymer melt consolidation inside the mold cavity distorts fine surface topography during the cooling phase. Thermoplastic resins undergo volumetric contraction as temperature drops from processing processing windows down to tool wall temperatures. Cooling rates dictate local volumetric shrinkage, causing high spatial frequency mold insert features to replicate with reduced depth amplitude relative to original steel or nickel geometry.
Mold temperature directly controls polymer skin freezing.

Replication of Diamond Turned Tooling
Single-point diamond turned nickel-phosphorus inserts transfer high-frequency turning grooves directly into the solidifying polymer skin. Resin viscosity, holding pressure, and melt temperature determine how effectively polymer chains fill fine insert grooves before the frozen layer forms. High holding pressures above eighty megapascals force the molten polymer into micro-grooves, yielding surface replication fidelity exceeding ninety-five percent for spatial periods larger than two micrometers.
Thermal expansion alters cavity geometry.
Lower holding pressure allows surface tension to smooth out sharp sub-micron features, rounding peak-to-valley profile heights. Cyclic olefin polymers exhibit superior micro-replication compared to polycarbonate due to lower melt viscosity and reduced molecular entanglement at processing temperatures. High injection pressure improves boundary fidelity.
Measuring replicated optics with noncontact metrology without applying proper deconvolution underpredicts true tool surface replication ratios.
Polymer melt elasticity suppresses replication of sub-micron diamond turning grooves when cavity holding pressure drops below thirty megapascals.
Thermal Sag and Mid-Spatial Ripple
Differential thermal contraction across thick lens cross-sections introduces long-wavelength surface figure errors. Non-uniform wall thickness causes uneven heat extraction rates through tool steel cooling circuits, resulting in localized surface sink and thermal sag. These long-wavelength distortions manifest as low spatial frequency figure errors in power spectral density calculations, distorting wavefront performance in multi-element optical assemblies.
Uncompensated machine chatter destroys optical clarity. High-frequency chatter frequencies during tool insert machining combine with polymer cooling shrink profiles to produce complex mid-spatial frequency ripple. Applying variable spatial cutoffs during optical inspection separates structural mold sag from insert machining marks, isolating tool fabrication errors from injection moulding process drift.
| Polymer Material Grade | Glass Transition Temp (C) | Injection Pressure (MPa) | Mould Cavity Ra (nm) | Replicated Optics Ra (nm) |
|---|---|---|---|---|
| Cyclic Olefin Polymer (Zeonex 480R) | 138 | 95 | 1.2 | 1.3 |
| Polymethyl Methacrylate (PMMA 8N) | 105 | 85 | 1.2 | 1.5 |
| Polycarbonate (Lexan OQ3820) | 145 | 110 | 1.2 | 1.9 |
| Polyester (OKP-4HT) | 132 | 100 | 1.2 | 1.4 |
| Data measured via phase-shifting interferometry at 632.8 nm wavelength, with high spatial cutoff set to 0.08 mm. | ||||
- Melt temperature settings govern initial resin viscosity and boundary skin solidification rates during the initial cavity filling phase.
- Packing pressure profile maintains physical melt contact against cavity insert walls until gate freeze-off halts mass transfer into the mold cavity.
- Tool surface temperature dictates local thermal gradient steepness, influencing polymer molecular orientation and surface skin stress levels.
- Cooling phase duration allows internal bulk stresses to relax prior to mold opening and part ejection from core inserts.
Mistaking volumetric cooling shrinkage sag for high-frequency tool chatter yields unnecessary diamond turning insert replacement cycles that inflate unit production costs.
Audit
Calibration procedures demand traceable step height standards and calibrated transfer standards to verify spatial frequency roll-off boundaries. Instrument calibration requires periodic measurement of certified silica or SiC optical flats and step-height standards traceable to national metrology institutes. Verification of noncontact interferometric instruments confirms spatial bandwidth response consistency before qualified lens production commences.
Traceable step standards ground spatial measurement scales.

Reference Artifact Metrology Integration
Calibrated optical flat standards establish absolute phase baseline offset values prior to scanning moulded polymer parts. Step-height reference artifacts verify height axis scale linearity, while spatial frequency grids assess optical lateral transfer function accuracy across the full field of view. Evaluating spatial instrument transfer functions using sinusoidal relief standards ensures spatial roll-off deconvolution matrices operate on mathematically sound baseline profiles.
Systematic phase errors arise when reference mirror flatness degrades or optical path contamination alters fringe contrast across the detector. Measuring calibrated reference standards under variable spatial cutoff filters isolates instrument electronic noise from physical surface features. Environmental vibration spikes appear as artificial spatial frequencies during phase retrieval, requiring continuous monitoring via reference isolation sensors during critical inspection runs.

How Does Variable Spatial Cutoff Shift Phase Reconstruction?
Adjusting spatial frequency boundaries alters calculated root-mean-square roughness values by excluding or including mid-spatial waviness bands. Shifting the spatial cutoff lambda-c from zero point eight millimeters down to zero point zero eight millimeters strips long-wavelength figure errors from the calculation array, isolating fine surface roughness. Filtered profiles alter calculated roughness metrics.
Excluding mid-spatial frequencies suppresses the detected impact of mold tool chatter, skewing quality compliance metrics. When spatial cutoff parameters are widened to capture long spatial wavelengths, local surface slope errors merge into overall figure error metrics. Standardizing spatial frequency cutoff boundaries across metrology protocols eliminates discrepancies between toolmaker quality release reports and customer receiving dock inspection audits.
| Band Designation | Spatial Wavelength Range (mm) | Primary Defect Source | Metrology Method | Standard Cutoff λc (mm) |
|---|---|---|---|---|
| Figure Error (Form) | > 2.5 | Mold Cavity Sag & Thermal Shrink | Low-Mag Interferometry | 8.0 |
| Waviness (MSF) | 0.08 to 2.5 | Machine Tool Chatter & Feed Marks | Phase Shifting Interferometry | 0.8 |
| Roughness (HSF) | < 0.08 | Diamond Grain & Polish Scratches | High-NA Coherence Scanning | 0.08 |
- Bandpass filter verification requires verifying upper and lower spatial frequency attenuation slopes against theoretical transfer profiles.
- Lateral magnification calibration ensures pixel pitch grid spacing matches certified master grid artifact dimensions across both transverse camera axes.
- Phase noise floor measurement quantifies instrument background noise by recording static flat standards over fifty consecutive acquisition cycles.
- Environmental drift assessment tracks low-frequency phase shifts caused by temperature fluctuations during extended multi-part automated inspection runs.
Suppliers frequently attribute observed mid-spatial frequency phase errors to high-frequency instrument noise rather than acknowledging uncompensated machine tool vibration during insert fabrication.

Allowance
Commercial specifications for optical components bind target surface roughness metrics to specific instrument bandpass thresholds. Defining optical quality requirements without specifying spatial frequency cutoff boundaries leads to contractual ambiguity and incorrect part rejections. Part drawings carrying an Ra target of one point five nanometers must explicitly state upper and lower spatial cutoffs to enable reproducible quality audits.

Tooling Budget and Mold Amortization
Capital investment committed to ultra-precision nickel-plated inserts amortizes over total net cavity production yield. Insert replacement cycles increase mold maintenance costs. A single single-point diamond turned nickel-phosphorus mold insert costs approximately twelve thousand dollars to fabricate, cut, and post-polish to optical standards.
Amortizing tool cost across a production run of one hundred thousand cyclic olefin polymer lenses yields an initial tooling allocation of twelve cents per part.
Consider a practical engineering scenario to evaluate spatial cutoff impacts on quality yield calculations. Assume a production lot of fifty thousand injection-moulded optics inspected under two distinct spatial filtering protocols. Under a broad spatial cutoff setting of zero point eight millimeters, mid-spatial tool chatter marks are included in the roughness integration array, raising measured average roughness from one point four nanometers to two point one nanometers.
This spatial cutoff shift pushes twelve percent of the lot beyond the maximum allowed contract roughness limit of one point eight nanometers, causing six thousand parts to be rejected unnecessarily.
Scrapping six thousand good parts represents a direct material and machine-time loss of seven thousand two hundred dollars at a unit manufacturing cost of one dollar and twenty cents per lens. Re-inspecting the same lot with deconvolved phase data constrained to an ISO 10110-8 compliant high-frequency cutoff of zero point zero eight millimeters isolates diamond turning feed lines from overall figure error, restoring measured roughness to one point four nanometers and returning the lot yield to ninety-nine point four percent. Standard bandpass definitions resolve vendor specification disputes.
ISO 10110-8 spatial cutoff definitions bind surface micro-roughness evaluations to explicit upper and lower frequency spectral limits.
Contractual Bandpass Specification Standards
Formulating purchase agreements around ISO 10110-8 drawings prevents disputes regarding spatial cutoff definitions. Molding contract annexes must specify exact spatial evaluation lengths, instrument transfer deconvolution algorithms, and numerical aperture limits for noncontact metrology acceptance tests. Molded lens quotes depend on cutoff definitions.
Discrepancies in noncontact metrology reporting between toolmakers and moulding buyers usually stem from unaligned spatial frequency bandpass windows. When a buyer inspects arriving polymer optics using an uncalibrated low-coherence interferometer with high high-frequency noise, reported surface roughness values systematically exceed supplier quality certificates generated via deconvolved phase-shifting interferometry. Enforcing standardized deconvolution routines inside quality control documentation eliminates unearned financial penalties and tool re-polishing delays.
Specifying spatial frequency limits under ISO 10110-8 Clause 4 binds the supplier to explicit surface spectrum limits, transferring financial responsibility for non-conforming scatter losses back to the moulder.