Determining Cavitation Count and Cycle Time in Multi Cavity Injection Molds
Determining cavitation count and cycle time requires balancing thermal cooling physics against clamping limits, runner shear, and capital amortisation curves.

Heat
Cooling dictates the baseline economics of injection molding: heat conduction through polymer resin alone accounts for sixty to eighty percent of total cycle time. Thermoplastics conduct heat poorly, showing thermal diffusivity values between 0.08 and 0.15 square millimeters per second. When hot melt hits tool steel kept below solidification temperature, a frozen skin forms instantly against the cavity walls while the core remains liquid.
How fast that core sheds enthalpy determines when the part achieves enough rigidity to eject cleanly without warping.
Calculating required cooling time starts with the Fourier heat conduction equation, simplified to a one-dimensional transient model across the thickest unribbed wall section. Thermal conductivity changes continuously throughout cooling ~ dropping sharply as amorphous polymers pass their glass transition temperature or as semi-crystalline materials undergo exothermic crystallization. Standard approximations assume uniform initial melt temperature and constant mold wall temperatures, yielding an operational equation for cooling duration:
tc = left(frach2π2 · αright) · lnleft(frac4π · fracTm – TwTe – Twright)
Here, h is maximum nominal wall thickness in millimeters, α is polymer thermal diffusivity in square millimeters per second, Tm is melt temperature in degrees Celsius, Tw is mold-coolant interface wall temperature, and Te is part ejection temperature. Because wall thickness h is squared in the calculation, doubling wall thickness quadruples cooling time ~ regardless of press clamp speed or hydraulic capacity.
Thermal Diffusivity and Wall Thickness Physics
Polymer morphology governs how fast heat dissipates during phase changes inside the mold. Semi-crystalline resins like polypropylene, high-density polyethylene, and polyamide release considerable latent heat as crystals form, extending cooling times beyond those of amorphous resins such as polycarbonate or acrylonitrile butadiene styrene of equivalent wall thickness. Tooling material matters too: beryllium copper core pin inserts conduct heat four times faster than standard P20 tool steel, suppressing localized hot spots.
| Resin Grade | Melt Temperature (°C) | Mold Temperature (°C) | Ejection Temperature (°C) | Thermal Diffusivity (mm²/s) | Cooling Constant Factor (s/mm²) |
|---|---|---|---|---|---|
| Polypropylene Unfilled | 230 | 40 | 90 | 0.085 | 2.85 |
| ABS High Impact | 240 | 60 | 85 | 0.098 | 2.42 |
| Polyamide 66 (30% Glass) | 285 | 80 | 140 | 0.130 | 1.75 |
| Polycarbonate Medium Flow | 290 | 90 | 130 | 0.112 | 1.95 |
| PBT (30% Glass) | 260 | 70 | 130 | 0.125 | 1.68 |
Cooling channel geometry controls the thermal gradient between core and cavity inserts. Straight drilled water lines set two to three drill diameters back from cavity surfaces extract heat evenly. Conformal cooling channels 3D-printed via direct metal laser sintering follow complex contours at uniform depths, eliminating heat traps in deep ribs and cutting cooling time by twenty to thirty-five percent.
Cooling time scales quadratically with maximum nominal wall thickness for semi-crystalline polyolefins when mold temperature is held at forty degrees Celsius.
Coolant flow through mold passages must remain turbulent for effective heat transfer. Turbulence occurs when the Reynolds number inside the cooling lines exceeds 4,000 ~ calculated as fluid velocity times hydraulic diameter divided by kinematic viscosity. Laminar flow leaves a stagnant boundary layer along channel walls that insulates the coolant, causing core steel temperatures to drift upward during long production runs.
Injection Mold Open and Ejection Dead Times
Total cycle time combines active processing phases with machine dead time. The complete sequence progresses from mold close, clamp build, fill, pack and hold, screw recovery, and cooling, through mold open, mechanical ejection, and robot pick-and-place intervention. Shaving total cycle time requires trimming dry-cycle mechanical movements as aggressively as thermal cooling times.
Screw plastication needs to wrap up at least two seconds before the mold opens. Screw speed and back pressure determine recovery rate without inducing excessive shear heat that degrades the resin. If screw recovery outlasts part cooling, plastication becomes the bottleneck, leaving the press idle while waiting for the next shot to prepare.
Cycle time breaks down into distinct operational phases:
- Volumetric Filling Time depends on part mass, runner volume, and maximum allowable injection pressure to avoid gate jetting or excessive shear.
- Packing and Holding Phase maintains pressure at the core until the gate freezes, preventing backflow into the runner and controlling volumetric shrinkage.
- Screw Plastication Duration is driven by screw speed, back pressure, and barrel heating needed to melt incoming resin pellets uniformly.
- Dry Cycle Dead Time covers raw mechanical motion: platen travel, core pull timing, ejector stroke, and robot pick-and-place dynamics.
Calculating total cycle duration involves combining active thermal phases with fixed mechanical movements, balancing cooling constraints against press speed capabilities across shifts.
Tcycle = tinjection + tpack + max(tcool, trecovery) + topen + teject + treset
Published machine dry-cycle speeds assume ideal toggle or hydraulic movement under zero mold load. Real-world tooling carrying heavy core plates, slides, and hot runner manifolds requires controlled acceleration and deceleration ramps to protect alignment pins, adding one to three seconds to baseline numbers.

Tonnage
Proper clamp force prevents parting line flash without crushing tool steel under repeated loading. Pressure inside the cavity acts outward against mold surfaces, pushing core and cavity plates apart along the parting line. Total clamp force must safely exceed the integrated cavity force generated during peak packing.
Determining required tonnage starts by calculating the projected surface area of all cavities and runners on the parting plane. Cavity pressure drops along the flow path, moving from peak pressure near the gate down to atmospheric pressure at the end of fill. During packing, typical cavity pressures range from 300 bar for commodity packaging up to 800 bar for tight-tolerance optical or connector parts.
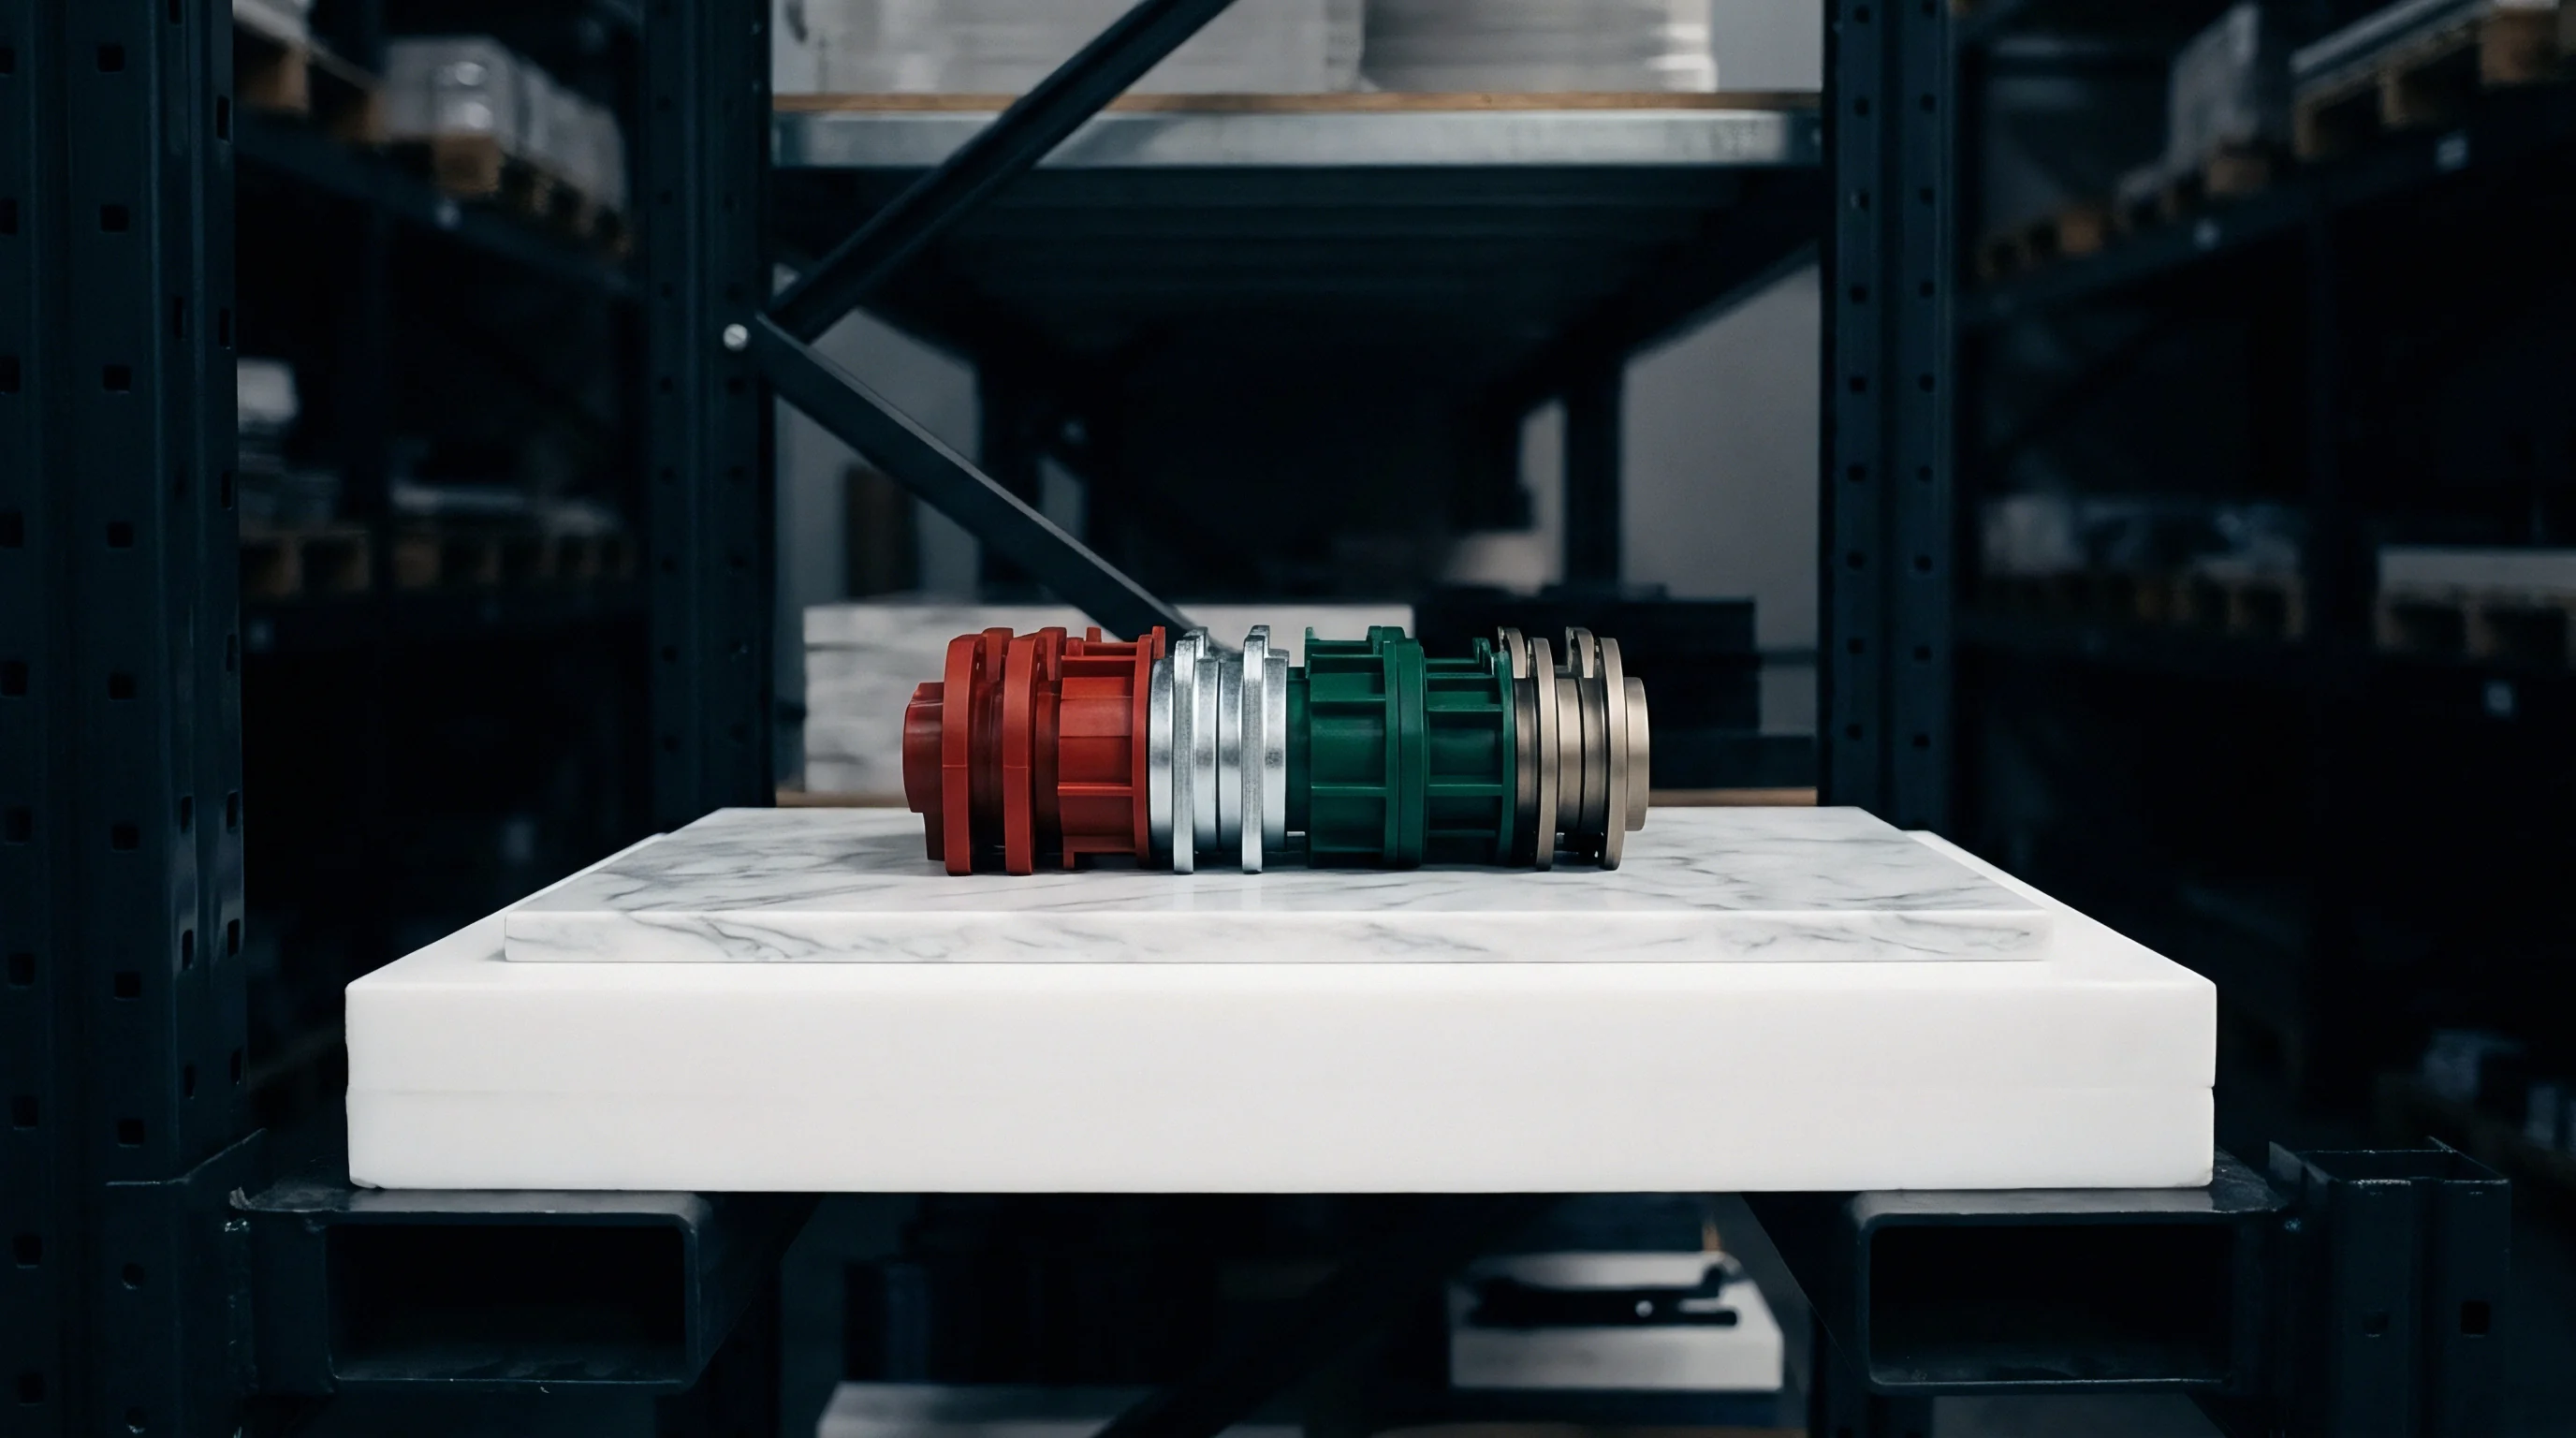
Projected Surface Area and Melt Pressure Distributions
Projected area is the two-dimensional shadow footprint of all parts and feed channels parallel to platen travel. For multi-cavity tools, part area is multiplied by cavitation count, adding the footprint of cold runners. Empirical rules of thumb call for 3.0 to 8.0 metric tons per square centimeter of projected area, depending on melt viscosity and flow-length-to-wall-thickness ratio.
Melt viscosity dictates the pressure needed to fill thin wall sections. High-viscosity resins like polycarbonate or polyetheretherketone demand higher injection pressures to overcome wall friction, elevating peak cavity pressure before gate freeze-off. Thin-wall electronic housings with flow ratios over 200:1 often require clamp forces around 7.5 tons per square centimeter to prevent flash during packing.
Clamp utilization is evaluated by comparing total projected load against tie-bar limits:
Fclamp = fracAprojected · Pcavity · Sfactor10,000
Here, Fclamp is required clamp force in metric tons, Aprojected is total projected area in square millimeters, Pcavity is average internal cavity pressure in bar, and Sfactor is a safety coefficient (usually 1.15 to 1.25) accounting for pressure spikes during injection acceleration.
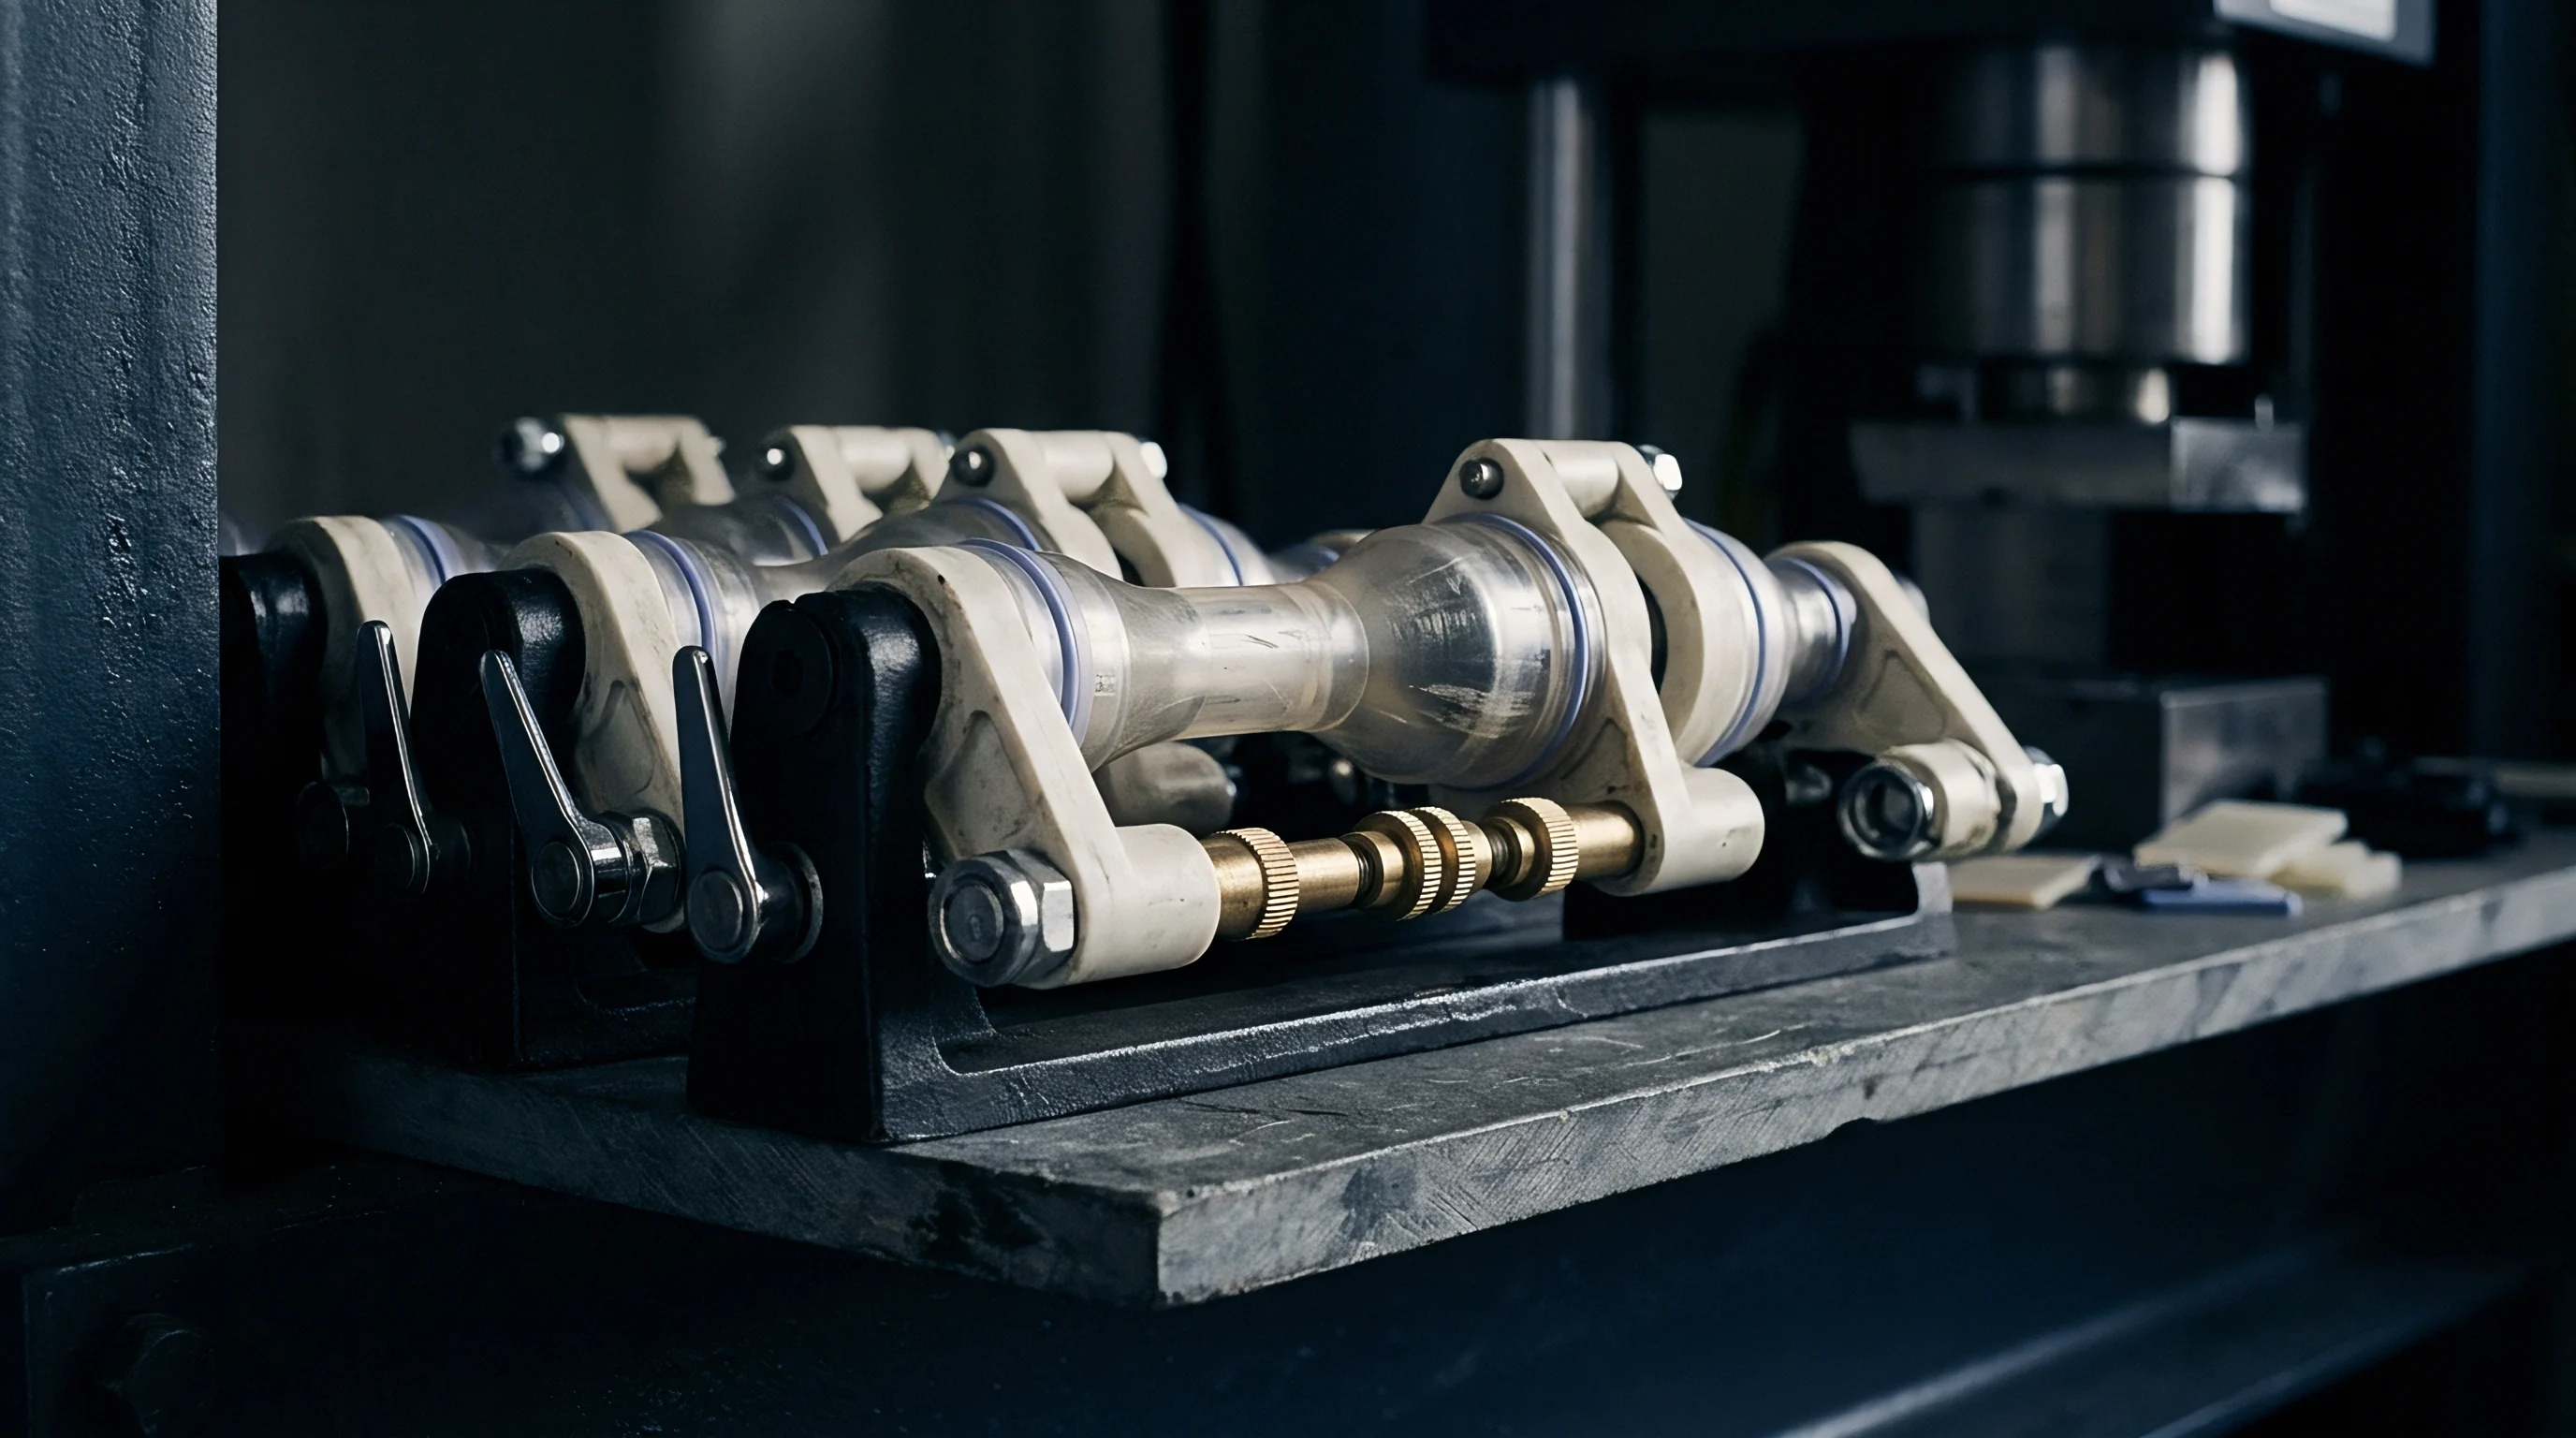
Machine Selection and Injection Unit Plasticating Rate
Barrel sizing balances shot capacity against resin residence time. A shot should take up twenty to eighty percent of the machine’s maximum displacement per stroke. Sizing under twenty percent keeps polymer in the heated barrel too long, causing thermal degradation, burnt additives, and lost molecular weight.
Exceeding eighty percent risks thermal variation across the shot because the screw lacks sufficient stroke length to melt resin uniformly.
Selecting a press requires validating hydraulic, mechanical, and thermal limits before committing tooling dollars:
- Maximum Tie Bar Clearance sets the outer mold base dimensions that can fit between platens without obstruction.
- Platen Daylight Limits define achievable minimum and maximum mold height, along with stroke needed for core pulls and robot clearance.
- Plasticating Capacity caps throughput in kilograms per hour, which can bottleneck cycle speed on high-cavitation or heavy-shot tooling.
- Ejection Force Capacity provides the mechanical thrust needed to push parts off deep core features without binding the ejector plate.
Plastication limits are gauged by comparing material mass demand against the machine’s melt rate under backpressure. If plasticating capacity falls short, operators are forced to stretch cooling cycles artificially, driving up piece costs.
Standard DIN 16742 Class TG4 calls for continuous cavity pressure monitoring to hold dimensional consistency shot after shot.
Core pulls and side actions increase required press size and cycle time. Angled horn pins driving slide mechanisms require extra opening stroke before ejection can safely fire. Hydraulic core cylinders controlled by press software need dedicated dwell times before mold close and open, adding dead time to the sequence.
Sizing clamp tonnage to peak projected load prevents flash while keeping press hydraulics from running in continuous thermal overload.

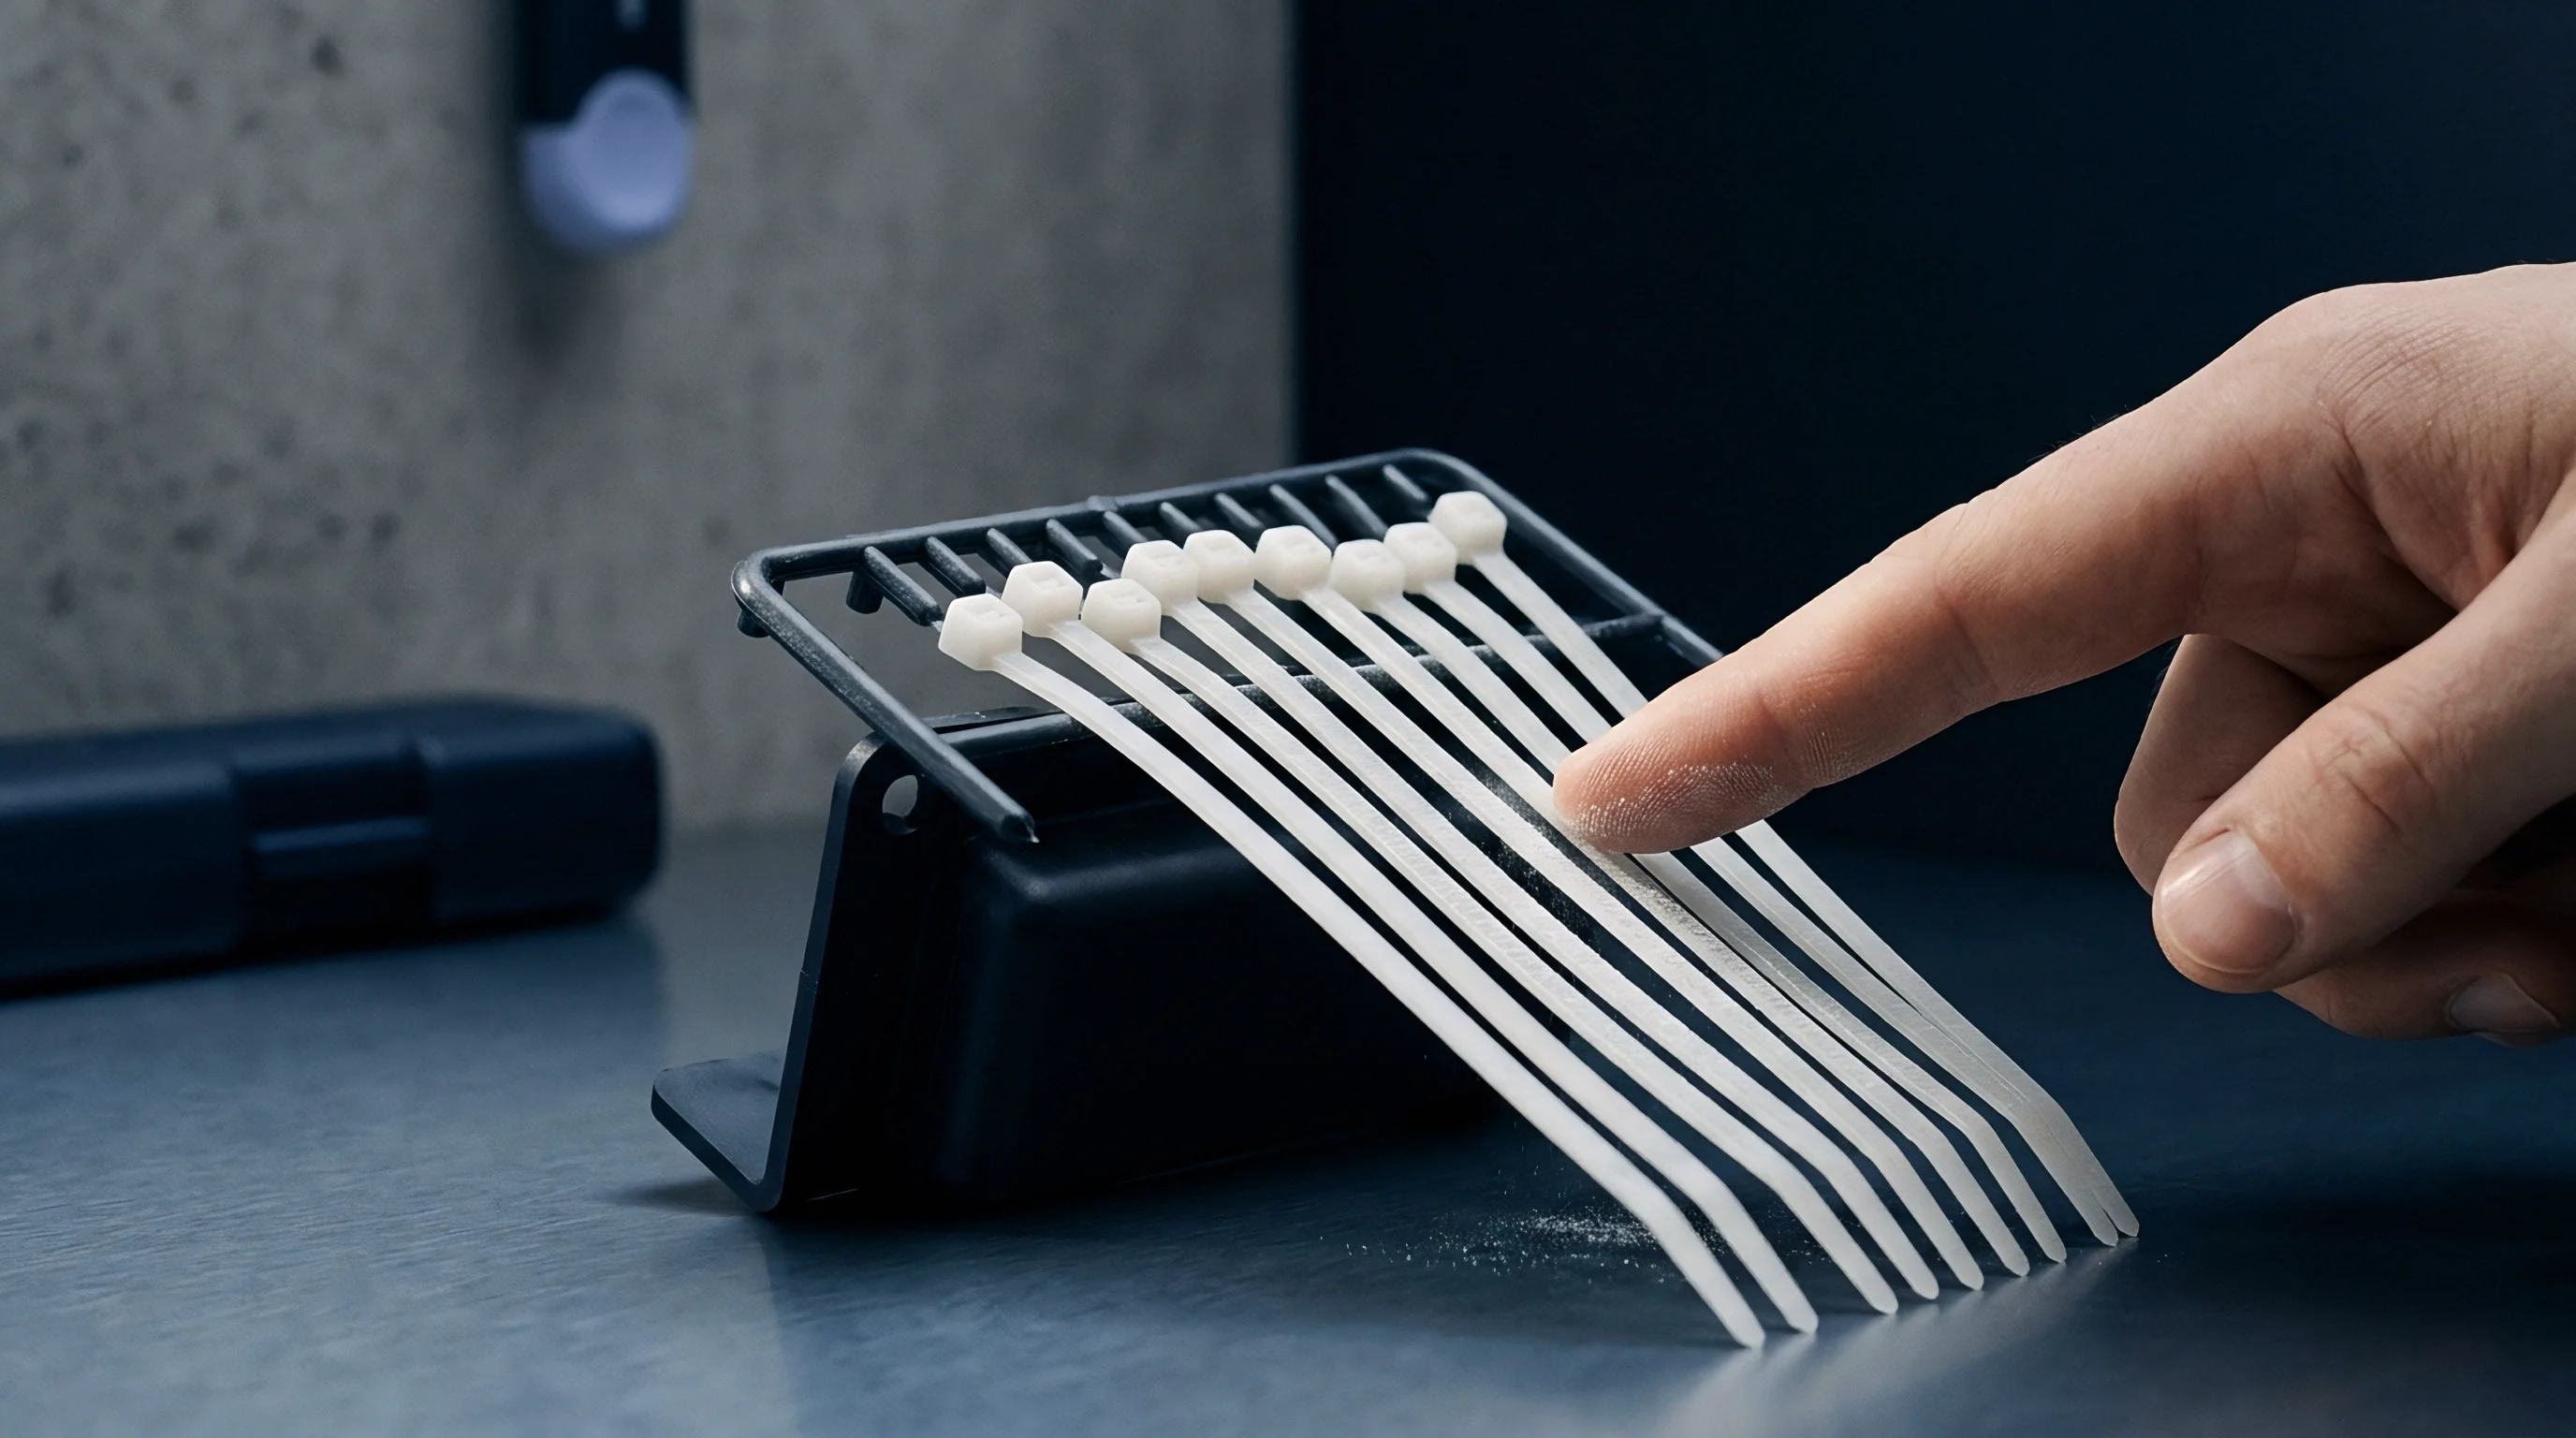
Balance
Equal flow across every cavity is critical to part consistency, weight control, and dimensional stability in multi-cavity tooling. Rheological imbalance happens when molten polymer experiences different thermal or shear histories in different runner branches. As a result, cavities pack out unequally, causing flash on early-filling cavities while late-filling ones suffer sink marks or short shots.
Geometric balance does not guarantee hydraulic balance at high injection speeds. Polymer melt is non-Newtonian and shear-thinning. Friction along runner walls creates localized shear heating, lowering viscosity in outer melt layers while leaving the central core cooler and thicker.
When flow splits at runner tees, these low-viscosity outer layers distribute unevenly into sub-runners, throwing off fill balance even in symmetrical mold layouts.

Rheological Symmetry and Shear-Induced Melt Differences
Standard H-pattern runners keep flow distances identical, but they often introduce severe shear stratification. As melt turns from primary to secondary runners, the split directs hotter outer-wall material into inner cavities and cooler core material into outer ones. This thermal mismatch alters packing density, causing uneven volumetric shrinkage across parts.
| Runner Branching Level | Channel Geometry | Hydraulic Diameter (mm) | Shear Rate (1/s) | Effective Viscosity (Pa·s) | Pressure Drop (bar) |
|---|---|---|---|---|---|
| Primary Sprue Runner | Full Round | 9.5 | 1,200 | 180 | 45 |
| Secondary Feed Branch | Modified Trapezoid | 7.0 | 3,500 | 110 | 85 |
| Tertiary Cavity Sub-Runner | Full Round | 5.0 | 8,200 | 65 | 140 |
| Submarine Gate Entry | Parabolic Pin-Point | 1.2 | 28,000 | 22 | 210 |
Melt rotation devices place static mixing inserts or specialized geometry into primary runners to reposition high-shear fluid layers before secondary splits. Shifting the fluid axis eighty degrees homogenizes temperature across the stream, eliminating shear-driven fill differences between inner and outer cavities.
Naturally balanced runners deliver identical melt history to every cavity only if shear exposure remains equal throughout the feed system.
Star runners radiate from a central sprue at equal angles, feeding circular cavity layouts through identical paths. While this delivers matching thermal and shear conditions to every cavity, it limits how tightly cavities can be packed on a mold base and complicates robot end-of-arm tooling compared to standard grid layouts.
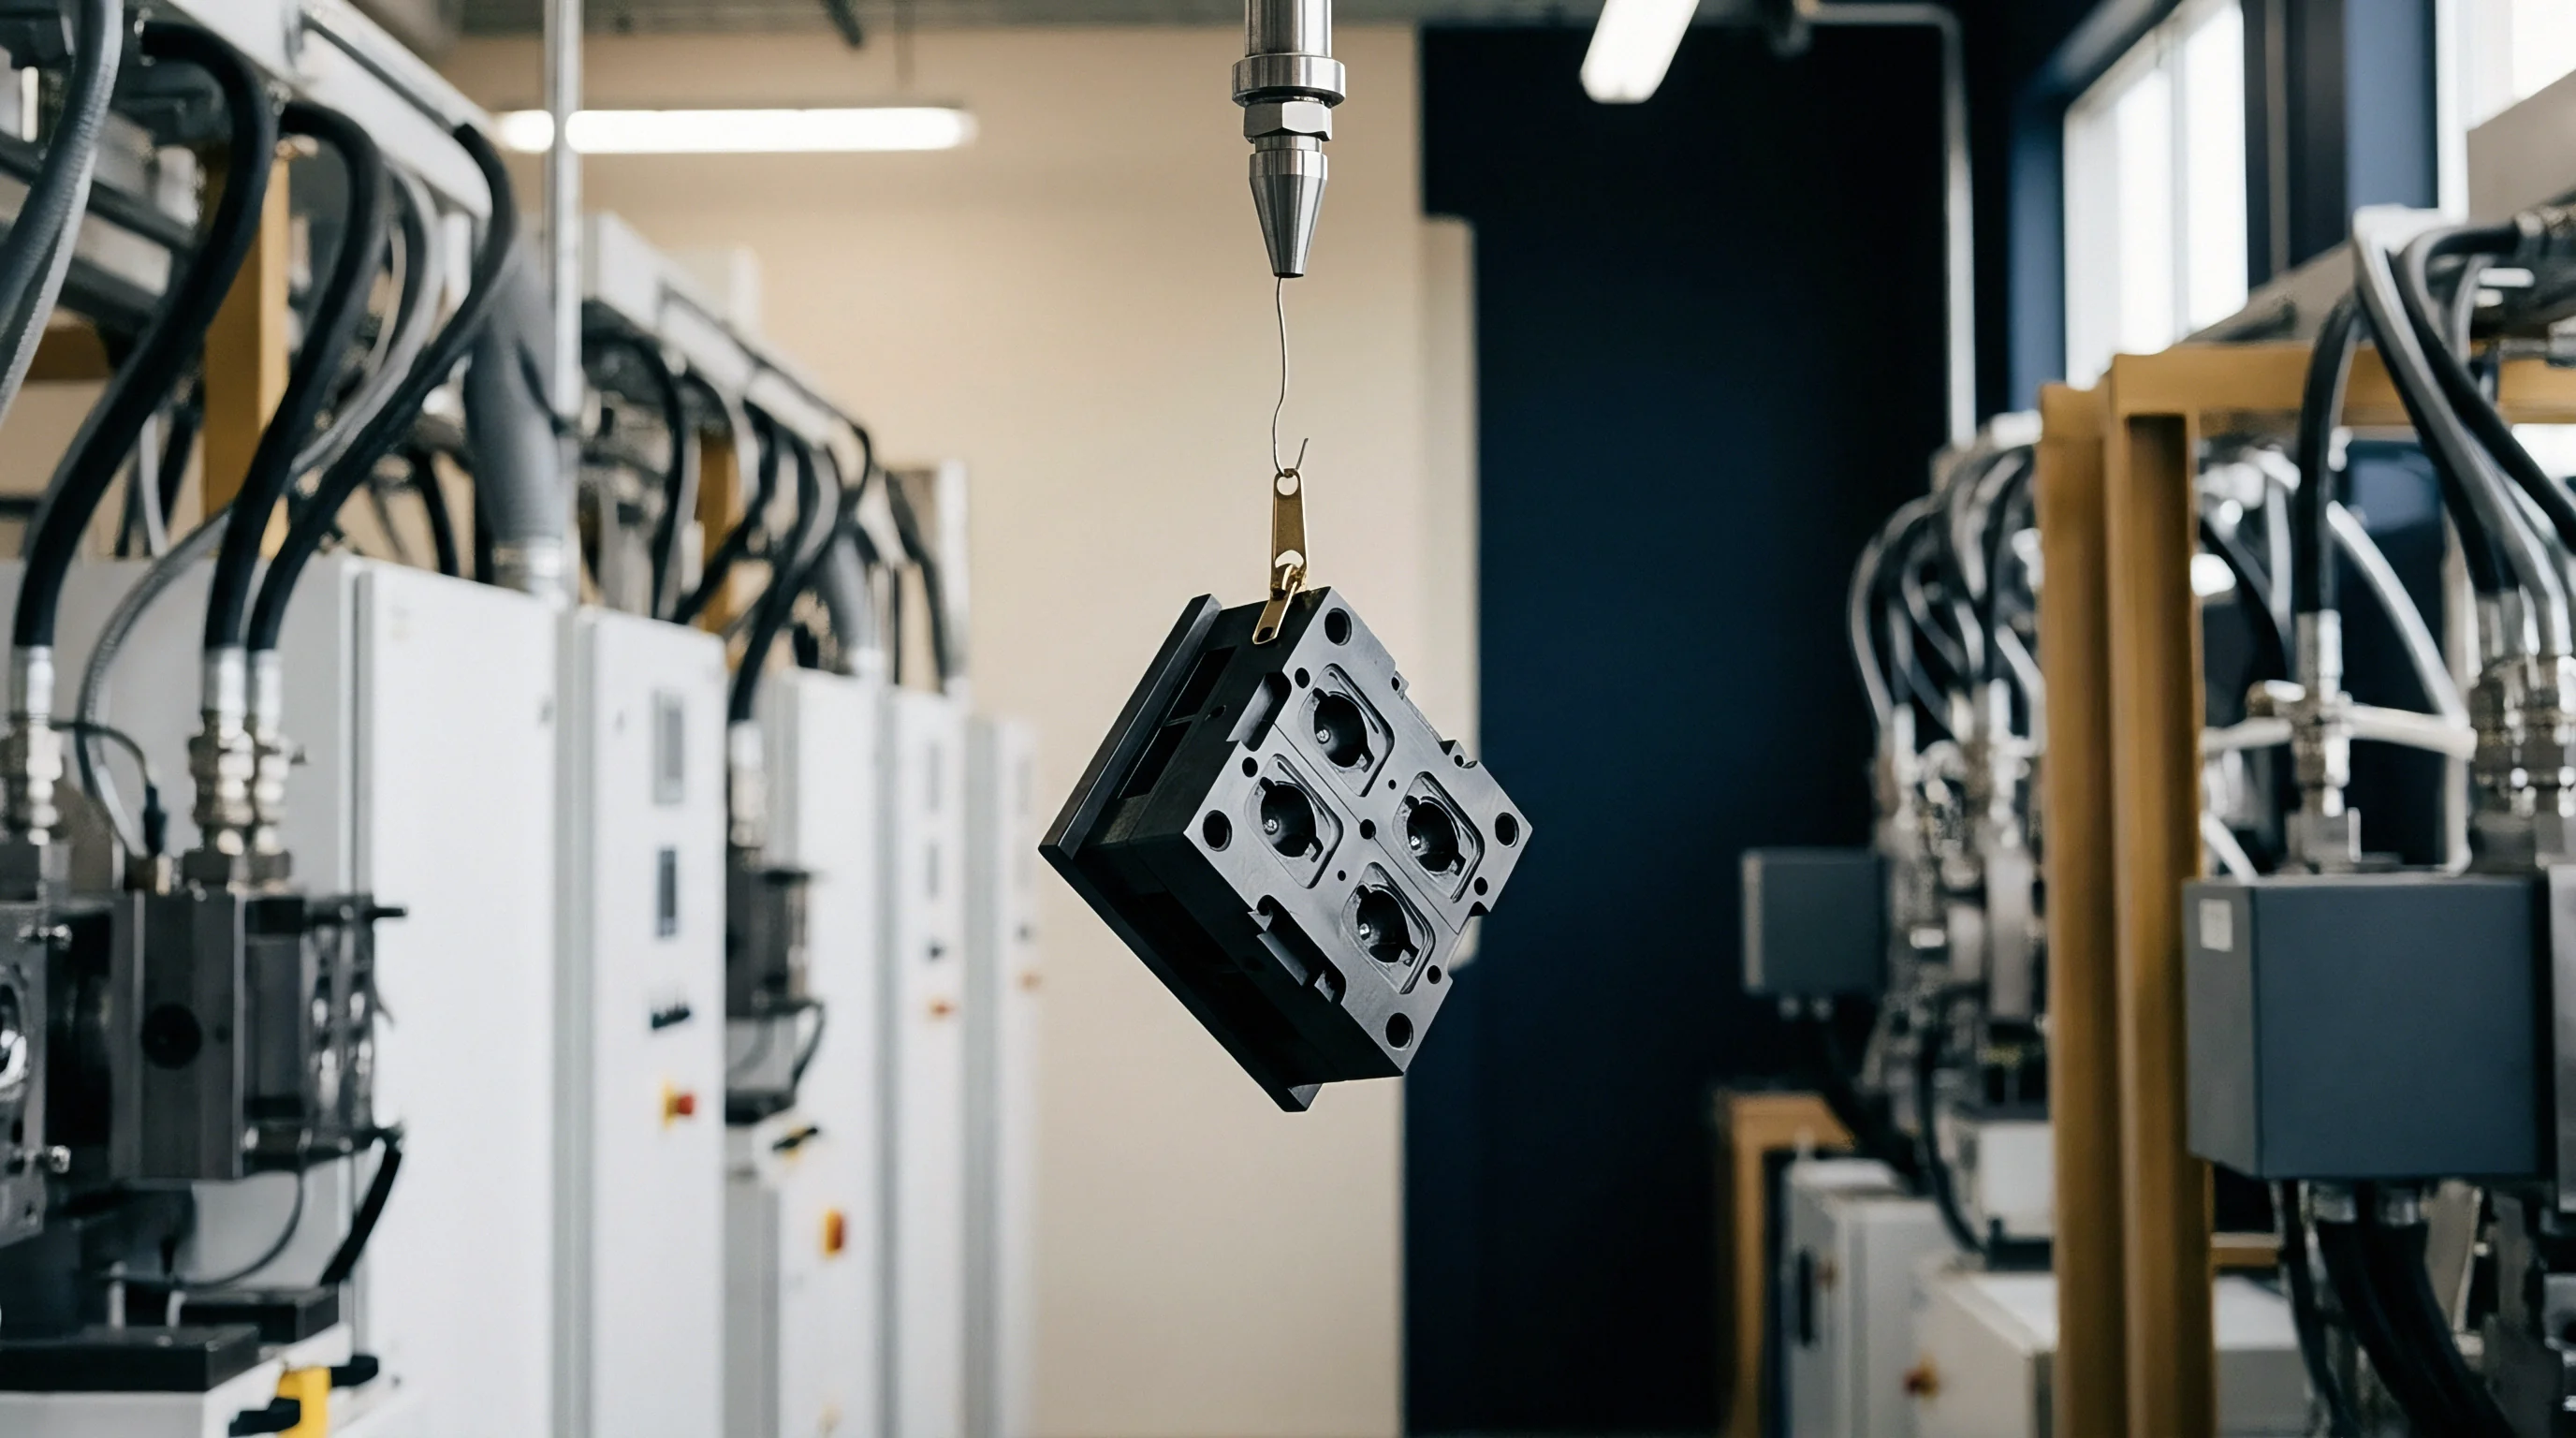
Does Geometric Symmetry Guarantee Equal Filling Velocity?
Geometric symmetry fails to guarantee equal flow rates when non-linear shear thinning alters localized flow resistance at runner splits. Pressure drops in circular runners require power-law fluid models rather than basic Newtonian equations:
Δ P = frac2 · K · LR · left( frac4 · Qπ · R3 · frac3n + 14n right)n
Here, Δ P is pressure drop across the runner, L is runner length, R is runner radius, Q is volumetric flow rate, K is material consistency index, and n is non-Newtonian power-law index. Because power-law values for engineering resins range between 0.2 and 0.4, small variations in shear rate create non-linear drops in viscosity, driving fill imbalance across sub-runners.
- Machining runner channels to conservative trial dimensions allows initial flow testing without risking cavity flash.
- Molding a short-shot series in five percent volumetric steps maps flow front positions across all cavities at actual injection speeds.
- Weighing short-shot parts from each cavity on analytical scales maps fill percentage variances.
- EDM steel removal opens sub-runners feeding slow cavities, balancing fill velocity.
- Running confirmation shots verifies that fill balance holds within a plus or minus two percent weight variance across the processing window.
Cold runner waste grows with cavitation count in naturally balanced layouts. Heavy runner trees increase shot size, lengthening screw recovery time and adding re-grind overhead. Hot runner manifolds eliminate runner scrap and keep melt hot right up to the gate land, though at higher upfront tooling cost.
Ignoring shear-induced viscosity drops forces operators to overpack early-filling cavities just to fill late ones, causing residual stress, warp, and dimensional rejects across production lots.

Amortization
Tooling decisions balance initial capital investment against unit piece price. Higher cavitation drops part cost by spreading machine hourly rates across more parts per cycle. However, adding cavities increases upfront design and moldmaking costs while requiring larger presses with higher hourly billing rates.
Justifying additional cavities comes down to break-even volume ~ the point where piece-cost savings outweigh mold capital costs. Low production volumes suit fewer cavities running in smaller presses to limit financial risk. High-volume automotive or packaging programs justify complex, high-cavitation tools that push piece price down close to raw material cost.

Tooling Capital Cost versus Piece Price Break-Even Dynamics
Part cost aggregates raw material, machine-hour rates, labor, and tooling amortization into a single calculation:
Cpart = left( Mpart · Cresin · (1 + Sscrap) right) + left( fracRmaχne · Tcycle3600 · Ncavity right) + left( fracCtoolVtotal right)
Here, Cpart is net piece price, Mpart is part weight in kilograms, Cresin is resin cost per kilogram, Sscrap is scrap rate, Rmaχne is press machine-hour rate, Tcycle is total cycle time in seconds, Ncavity is active cavity count, Ctool is total mold capital cost, and Vtotal is total amortized production volume.
| Cavitation Count | Tooling Cost ($) | Press Size (Tons) | Press Rate ($/hr) | Cycle Time (s) | Part Cost at 100k Vol ($) | Part Cost at 1M Vol ($) |
|---|---|---|---|---|---|---|
| 2 Cavity | 28,000 | 100 | 42.00 | 18.5 | 0.438 | 0.158 |
| 4 Cavity | 48,000 | 180 | 58.00 | 19.0 | 0.584 | 0.152 |
| 8 Cavity | 82,000 | 320 | 85.00 | 20.0 | 0.890 | 0.150 |
| 16 Cavity | 145,000 | 500 | 130.00 | 21.5 | 1.530 | 0.235 |
Adding cavities beyond a certain point yields diminishing returns. Larger molds demand bigger presses with higher hourly rates. Cycle times can also drag on high-cavitation tooling due to longer runner paths, constrained cooling circuits, and extended robot travel strokes.
Adding cavities lowers piece price only until press hourly rates jump to the next frame size.
Designing in spare cavity capability offers insurance against downtime in high-volume runs. Modular, valve-gated hot runners allow a damaged cavity to be shut off electronically, keeping the mold running at reduced output while a replacement insert is machined.

Machine Capacity Utilization and Production Schedule Allocation
Scheduling requires matching mold dimensions and shot volume to press capacity. Running a mold in an oversized machine simply because it is available inflates part cost through excess overhead, eating away at profit margins.
Reviewing key financial factors keeps programs from miscalculating long-term tooling commitments:
- Total Expected Lifecycle Volume establishes total production demand across program life to set the baseline capital amortization.
- Press Tonnage Family Step-Up Thresholds flag cavitation jumps that force the job into a higher press cost tier.
- Mold Insert Replacement Schedule plans for steel wear and core replacements when molding abrasive glass-filled resins over long runs.
- Downtime Risk Exposure compares hourly financial loss if a single large tool drops out versus running parallel smaller tools.
Multi-sourcing strategies place two medium-cavitation molds in separate plants rather than running one giant tool in a single location. Spreading tooling reduces supply chain risk, cuts regional freight costs, and provides backup capacity during tool maintenance.
Tooling specs requiring SPI Class 101 mandate hardened steel over 54 Rockwell C, fully guided ejector plates, and nickel-plated water lines to resist internal corrosion and extend mold life.
Qualification
First article qualification confirms that multi-cavity tooling holds tolerance across every cavity position during production runs. Slight variations in CNC milling, sinker EDM, or hand polishing create subtle volume differences from cavity to cavity. Capability testing quantifies this variation to ensure parts meet drawing specs over full production shifts.
Statistical process control uses capability indices to evaluate tooling performance. The index Cp measures total spread against spec limits, while Cpk accounts for centering. Validating multi-cavity tooling requires calculating capability both within individual cavities and across the combined dataset to separate steel machining errors from machine instability.

Cavity-to-Cavity Dimensional Capability Mapping
Dimensional mapping involves measuring critical features across all cavities over a thirty-two shot sample run. Typical protocol targets dimensions like hole pitch, wall thickness, seal ring diameter, and total length. Measuring five consecutive shots on an eight-cavity mold yields forty data points per feature, giving a solid sample size for statistical review.
Splitting cavity-to-cavity variance from shot-to-shot variance isolates tooling issues from press drift. High variation within a single cavity across multiple shots points to hydraulic fluctuations, unstable barrel temperatures, or improper backpressure. High variation between cavities on the exact same shot points to steel discrepancies, gate land differences, or non-uniform cooling across mold plates.
Cpk = min left( fracUSL – μ3σ, fracμ – LSL3σ right)
Here, USL is upper specification limit, LSL is lower specification limit, μ is mean dimension across measured cavities, and σ is total standard deviation. A Cpk above 1.33 demonstrates baseline capability, though automotive and medical programs routinely require Cpk values over 1.67 across all cavity positions under DIN 16742 rules.
Engineers fine-tune individual cavity dimensions by adjusting steel inserts with precision grinding or micro-EDM. Fixing undersized features means taking steel off core or cavity inserts, but correcting oversized features requires laser welding followed by re-machining ~ which is why building steel-safe tools initially is critical for post-trial tuning.

Process Window Stability and Long-Term Thermal Drift
Process window studies define operational limits for injection speed, pack pressure, and melt temperature where all cavities yield good parts. Scientific molding relies on decoupled curves to separate fill velocity from packing pressure. Decoupled II and III protocols fill cavities to ninety-five percent under speed control before transferring to pressure control based on screw position or cavity pressure sensors.
Reaching thermal equilibrium in large multi-cavity mold bases can take up to two hours of continuous cycling. During startup, cold steel strips heat from the melt quickly, altering viscosity and part shrinkage. Final dimensional approval should wait until water return temperatures, core steel sensors, and hydraulic oil settle within plus or minus one degree Celsius of target setpoints.
Lot-to-lot resin viscosity shifts directly affect cavity fill balance. Melt Flow Rate specs from material suppliers carry tolerance bands of plus or minus fifteen percent under ISO 1133. A mold qualified on a high-MFR resin lot may produce short shots or under-packed cavities when switched to a lower-MFR lot, requiring a broader validated process window through structured design-of-experiments testing.
Whether linking real-time cavity pressure transducers directly to press hydraulic loops can completely eliminate shift-to-shift drift on high-cavitation tooling using recycled resin feeds remains an open question on the plant floor.