Density Testing Protocols under ISO 1183 for Customs Classification
ISO 1183 density testing determines customs tariff lines under Chapter 39; accurate classification demands exact fluid temperature control and plaque molding.

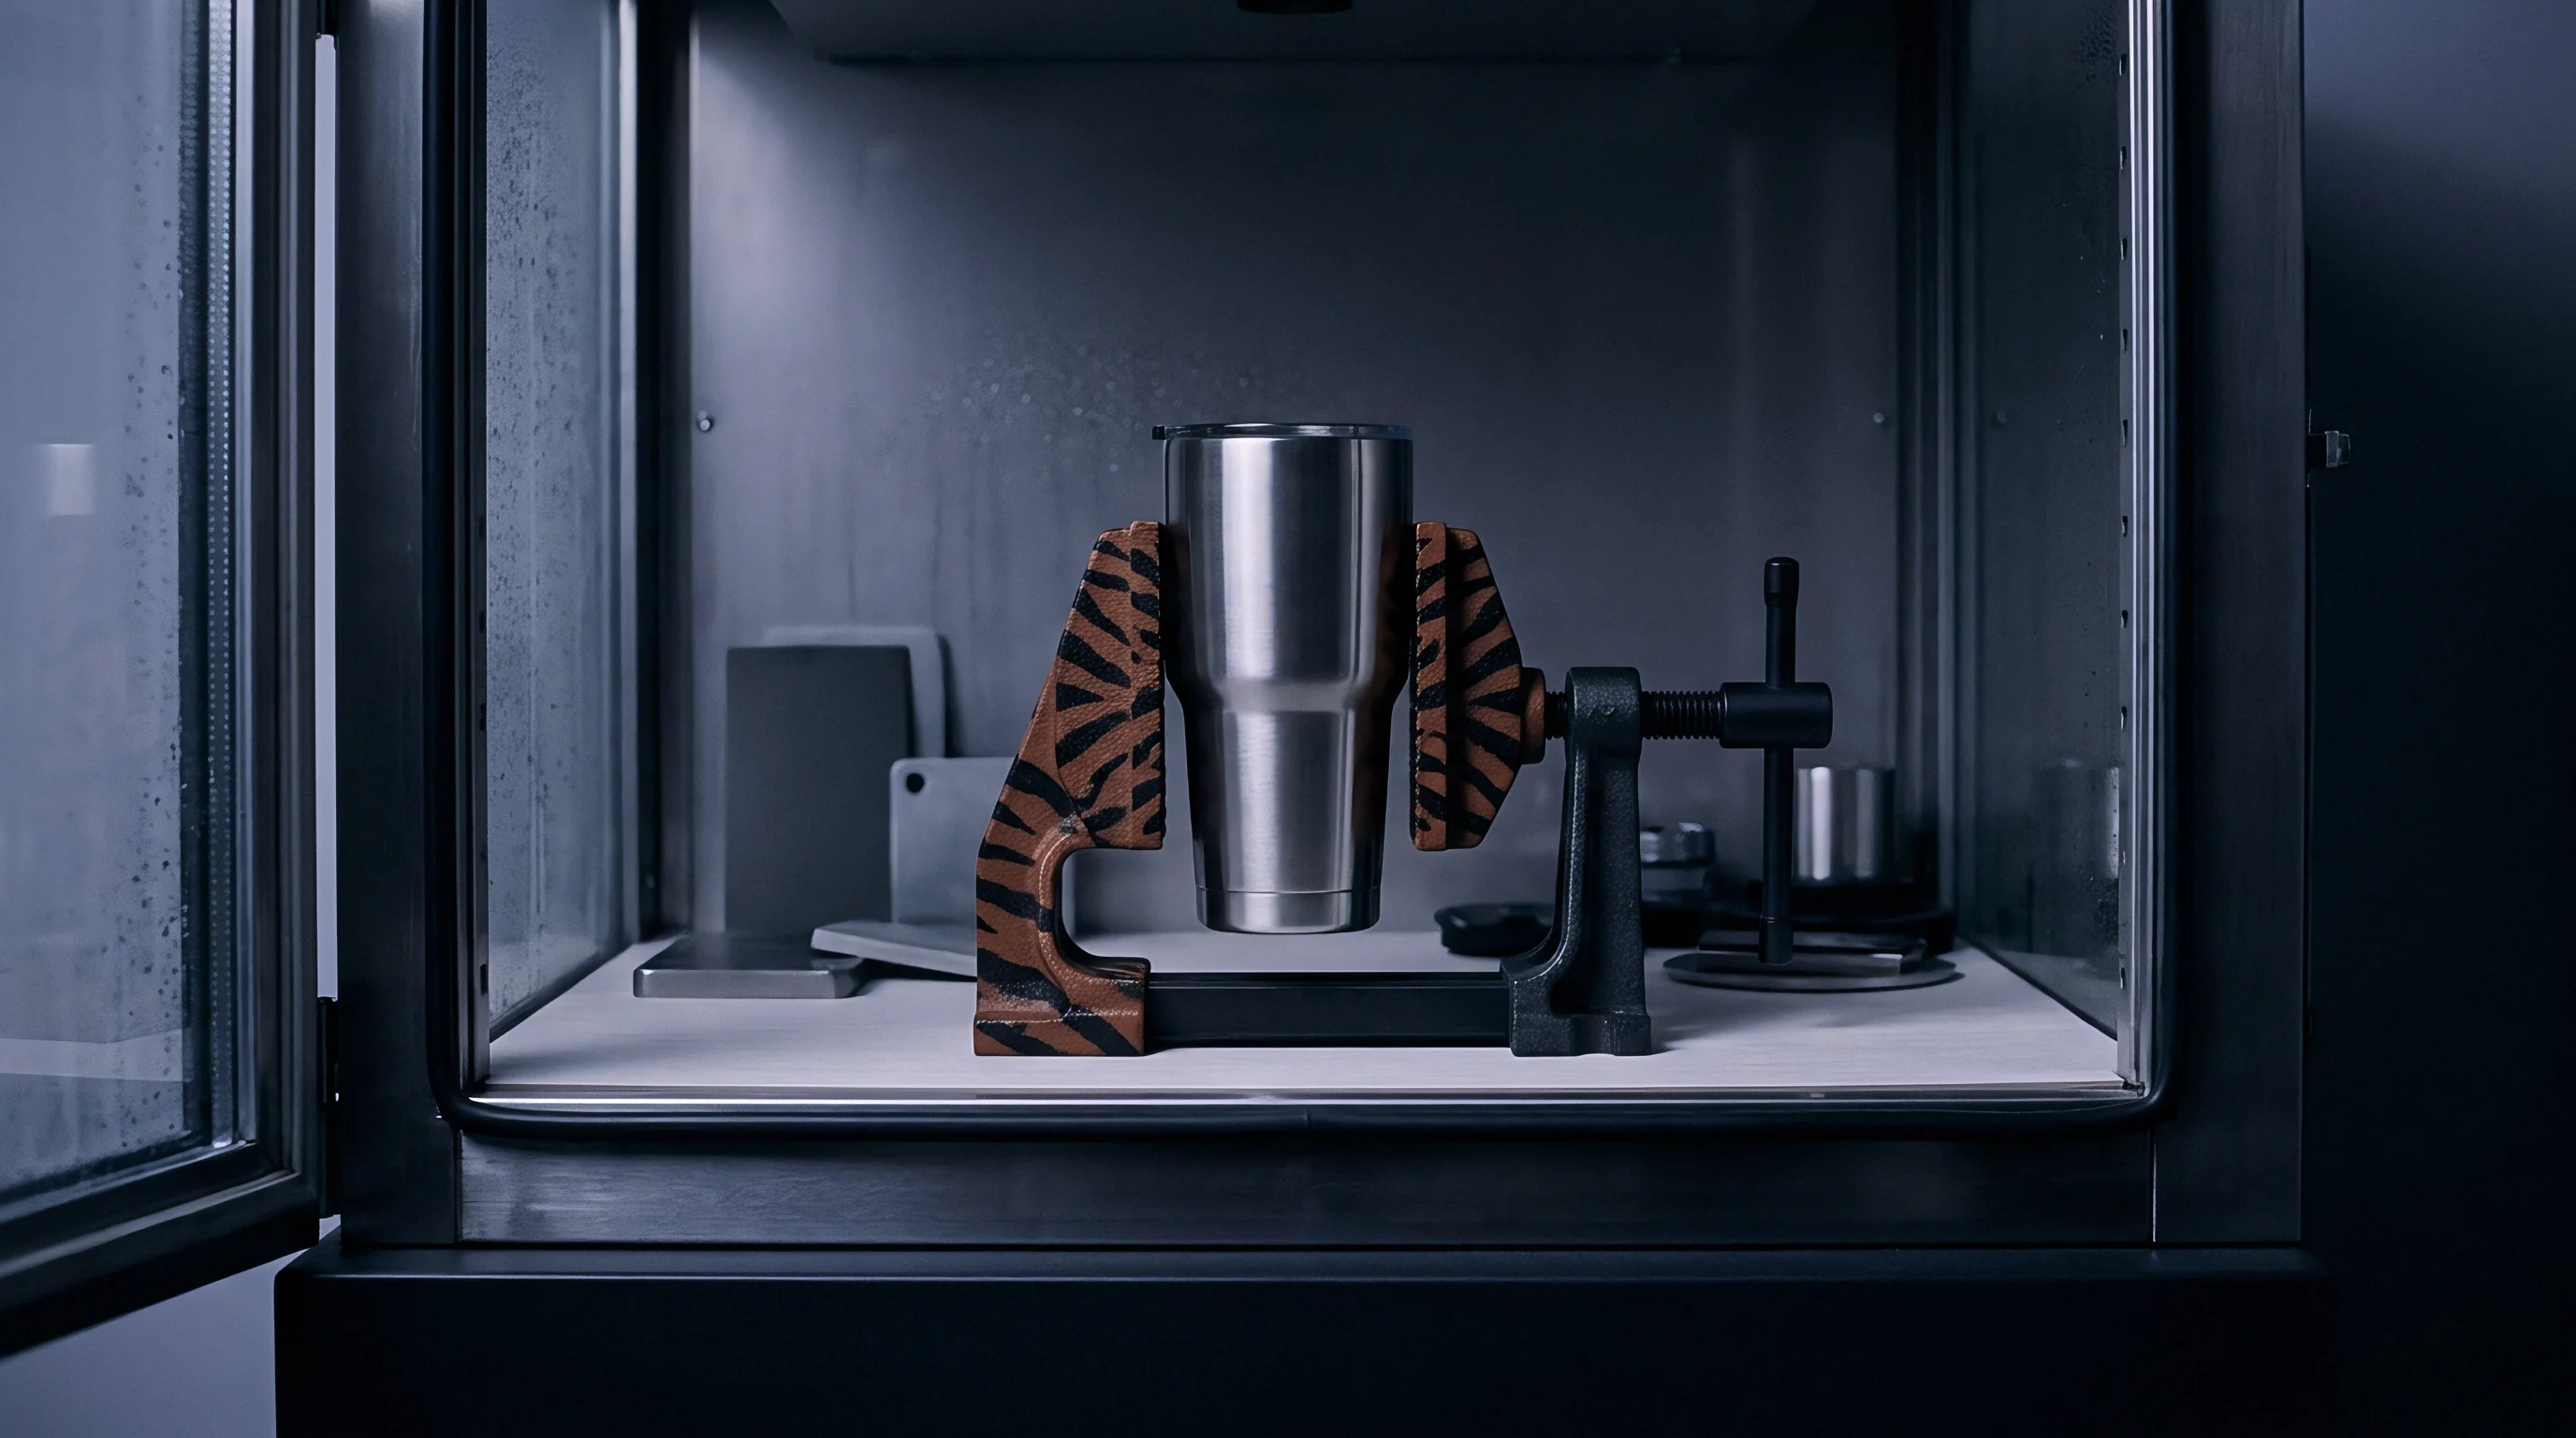
Displacement
Measuring the mass per unit volume of non-cellular plastics underpins customs classification, tariff assessments, and trade dispute resolution across international borders. Harmonized System Chapter 39 relies heavily on exact physical metrics to separate high-duty polymer compounds from lower-rated raw polymers. ISO 1183 defines three analytical methodologies to quantify polymer mass per unit volume: liquid immersion hydrostatic weighing under Method A, liquid pycnometry under Method B, and titration under Method C. When border enforcement agencies pull samples from incoming resin shipments, the choice of analytical method determines whether a consignment clears duty free, faces standard ad valorem rates, or incurs penalties for misclassification.
Where ISO 1183 protocols meet Chapter 39 tariff rules, the technical boundary between commercial raw material specs and customs lab testing becomes critical.
Hydrostatic weighing relies on measuring specimen weight in air against its weight in an immersion medium. ISO 1183-1 Method A mandates suspending a solid, bubble-free plastic sample in a thermostatic liquid bath using a fine suspension wire. The balance records dry mass in air, designated as mass in air, followed by submerged apparent mass, designated as apparent mass in liquid.
Solid density arises directly from Archimedes’ principle:
ρs = fraca · ρla – b
In this governing equation, (a) represents the specimen mass in air expressed in grams, (b) represents the apparent specimen mass submerged in the immersion fluid expressed in grams, and (rho_l) represents the density of the immersion liquid at the test temperature expressed in grams per cubic centimeter. Standard laboratory environments fix the measurement temperature at 23.0 °C ± 0.1 °C. Distilled or deionized water serves as the standard liquid medium, possessing a certified reference density of 0.99756 g/cm³ at 23.0 °C. For water-soluble polymers, hygroscopic resins, or low-density polyethylenes that float in pure water, alternative immersion fluids like ethanol, isopropyl alcohol, or n-heptane are specified alongside their temperature-calibrated density tables.

Archimedes Method Dynamics and Liquid Density Calibration
Precision hydrostatic balances require periodic calibration using traceable stainless steel weight standards to eliminate scale drift. When testing high-density polyethylene or polyoxymethylene pellets, surface tension along the suspension wire adds vertical forces that bias the apparent mass reading. ISO 1183-1 specifies fine wire diameters under 0.12 millimeters, typically constructed from platinum or corrosion-resistant stainless steel alloy, to minimize meniscus drag.
A correction factor accounts for the wire immersion depth, preventing systematic shifts in calculated polymer density.
Temperature stability within the immersion vessel directly controls mass determination accuracy. Water density changes by approximately 0.00023 g/cm³ per degree Celsius near 23.0 °C. A temperature drift of 1.5 °C shifts calculated resin density by 0.00035 g/cm³ ~ a margin sufficient to push a borderline low-density polyethylene pellet across the 0.940 g/cm³ threshold into a medium-density tariff code. Thermostatic circulating baths with calibrated Pt100 platinum resistance thermometers maintain thermal equilibrium to within ±0.05 °C during the weighing sequence, ensuring that the liquid density term remains constant throughout testing.
Consider an unpigmented linear low-density polyethylene sample evaluated via ISO 1183-1 Method A at 23.0 °C. The balance records a dry specimen mass in air of 12.4852 g. When submerged in distilled water containing 0.05% Triton X-100 surfactant, the balance records an apparent mass of 0.8124 g. Substituting these values into the hydrostatic equation yields:
ρs = frac12.4852 · 0.9975612.4852 – 0.8124 = frac12.4547311.6728 = 1.06698 g/cm3
This result immediately points to an anomaly. Natural linear low-density polyethylene exhibits a true density between 0.915 g/cm³ and 0.925 g/cm³. An experimental density of 1.0670 g/cm³ indicates heavy inorganic fillers, such as calcium carbonate or talc, added during compounding.
The physical immersion protocol uncovers formulation adjustments that alter customs tariff lines long before chemical composition testing begins.
Clause 5.2 of ISO 1183-1 specifies degassed distilled water at 23.0 °C ± 0.1 °C to prevent micro-bubble adhesion from skewing mass determinations.
Pycnometric Gas Expansion and Pellet Pore Penetration
Helium displacement techniques evaluate particle volume by measuring pressure differentials within calibrated reference chambers. ISO 1183-3 standardizes gas pycnometry as an alternative to liquid immersion for non-cellular plastics, particularly fine powders, regrind flakes, and porous masterbatch pellets. While liquid immersion can fail to penetrate narrow surface crevices due to surface tension, helium gas atoms possess a tiny kinetic diameter of 0.26 nanometers.
The gas freely enters open surface pores and micro-voids, measuring the absolute solid skeleton volume of the polymer compound rather than an inflated particle volume.
Gas pycnometers operate under controlled isothermal conditions using two interconnected stainless steel cells of known volume. The sample cell, holding specimen mass (m), undergoes pressurized helium dosing to an initial target pressure (P_1). Opening an internal expansion valve allows the helium to expand into an empty reference cell, dropping system pressure to an equilibrium value (P_2).
Applying the ideal gas law under constant temperature conditions yields the precise sample volume (V_s):
Vs = Vcell – fracVreffracP1 – PbaseP2 – Pbase – 1
Dividing the dry specimen mass (m) measured on an analytical balance by the pycnometric volume (V_s) produces the skeleton density. Gas pycnometry eliminates liquid disposal, reduces operator cycle time to under ten minutes, and delivers volumetric precision reaching ±0.0001 g/cm³. However, if internal gas pockets inside expanded pellets remain completely enclosed, helium cannot enter those closed voids.
The resulting measurement reflects apparent particle density including internal void volume, which differs systematically from true skeleton matrix density.
Customs enforcement agencies frequently utilize gas pycnometry for rapid screening at border check posts due to automated test cycles and high throughput capabilities. When analyzing polyolefin masterbatches containing carbon black, helium pycnometry isolates the combined volume of resin and pigment without risk of solvent swelling or liquid leaching. The chosen analytical methodology must remain fully documented on the certificate of analysis, as gas pycnometry and liquid hydrostatic weighing yield slightly divergent numerical values when testing micro-porous or heavily filled polymer matrices.
Clause 6.4 of ISO 1183-1 stipulates that test reports record the immersion medium, specimen preparation method, and thermal conditioning window to preserve evidentiary validity during customs tariff audits.
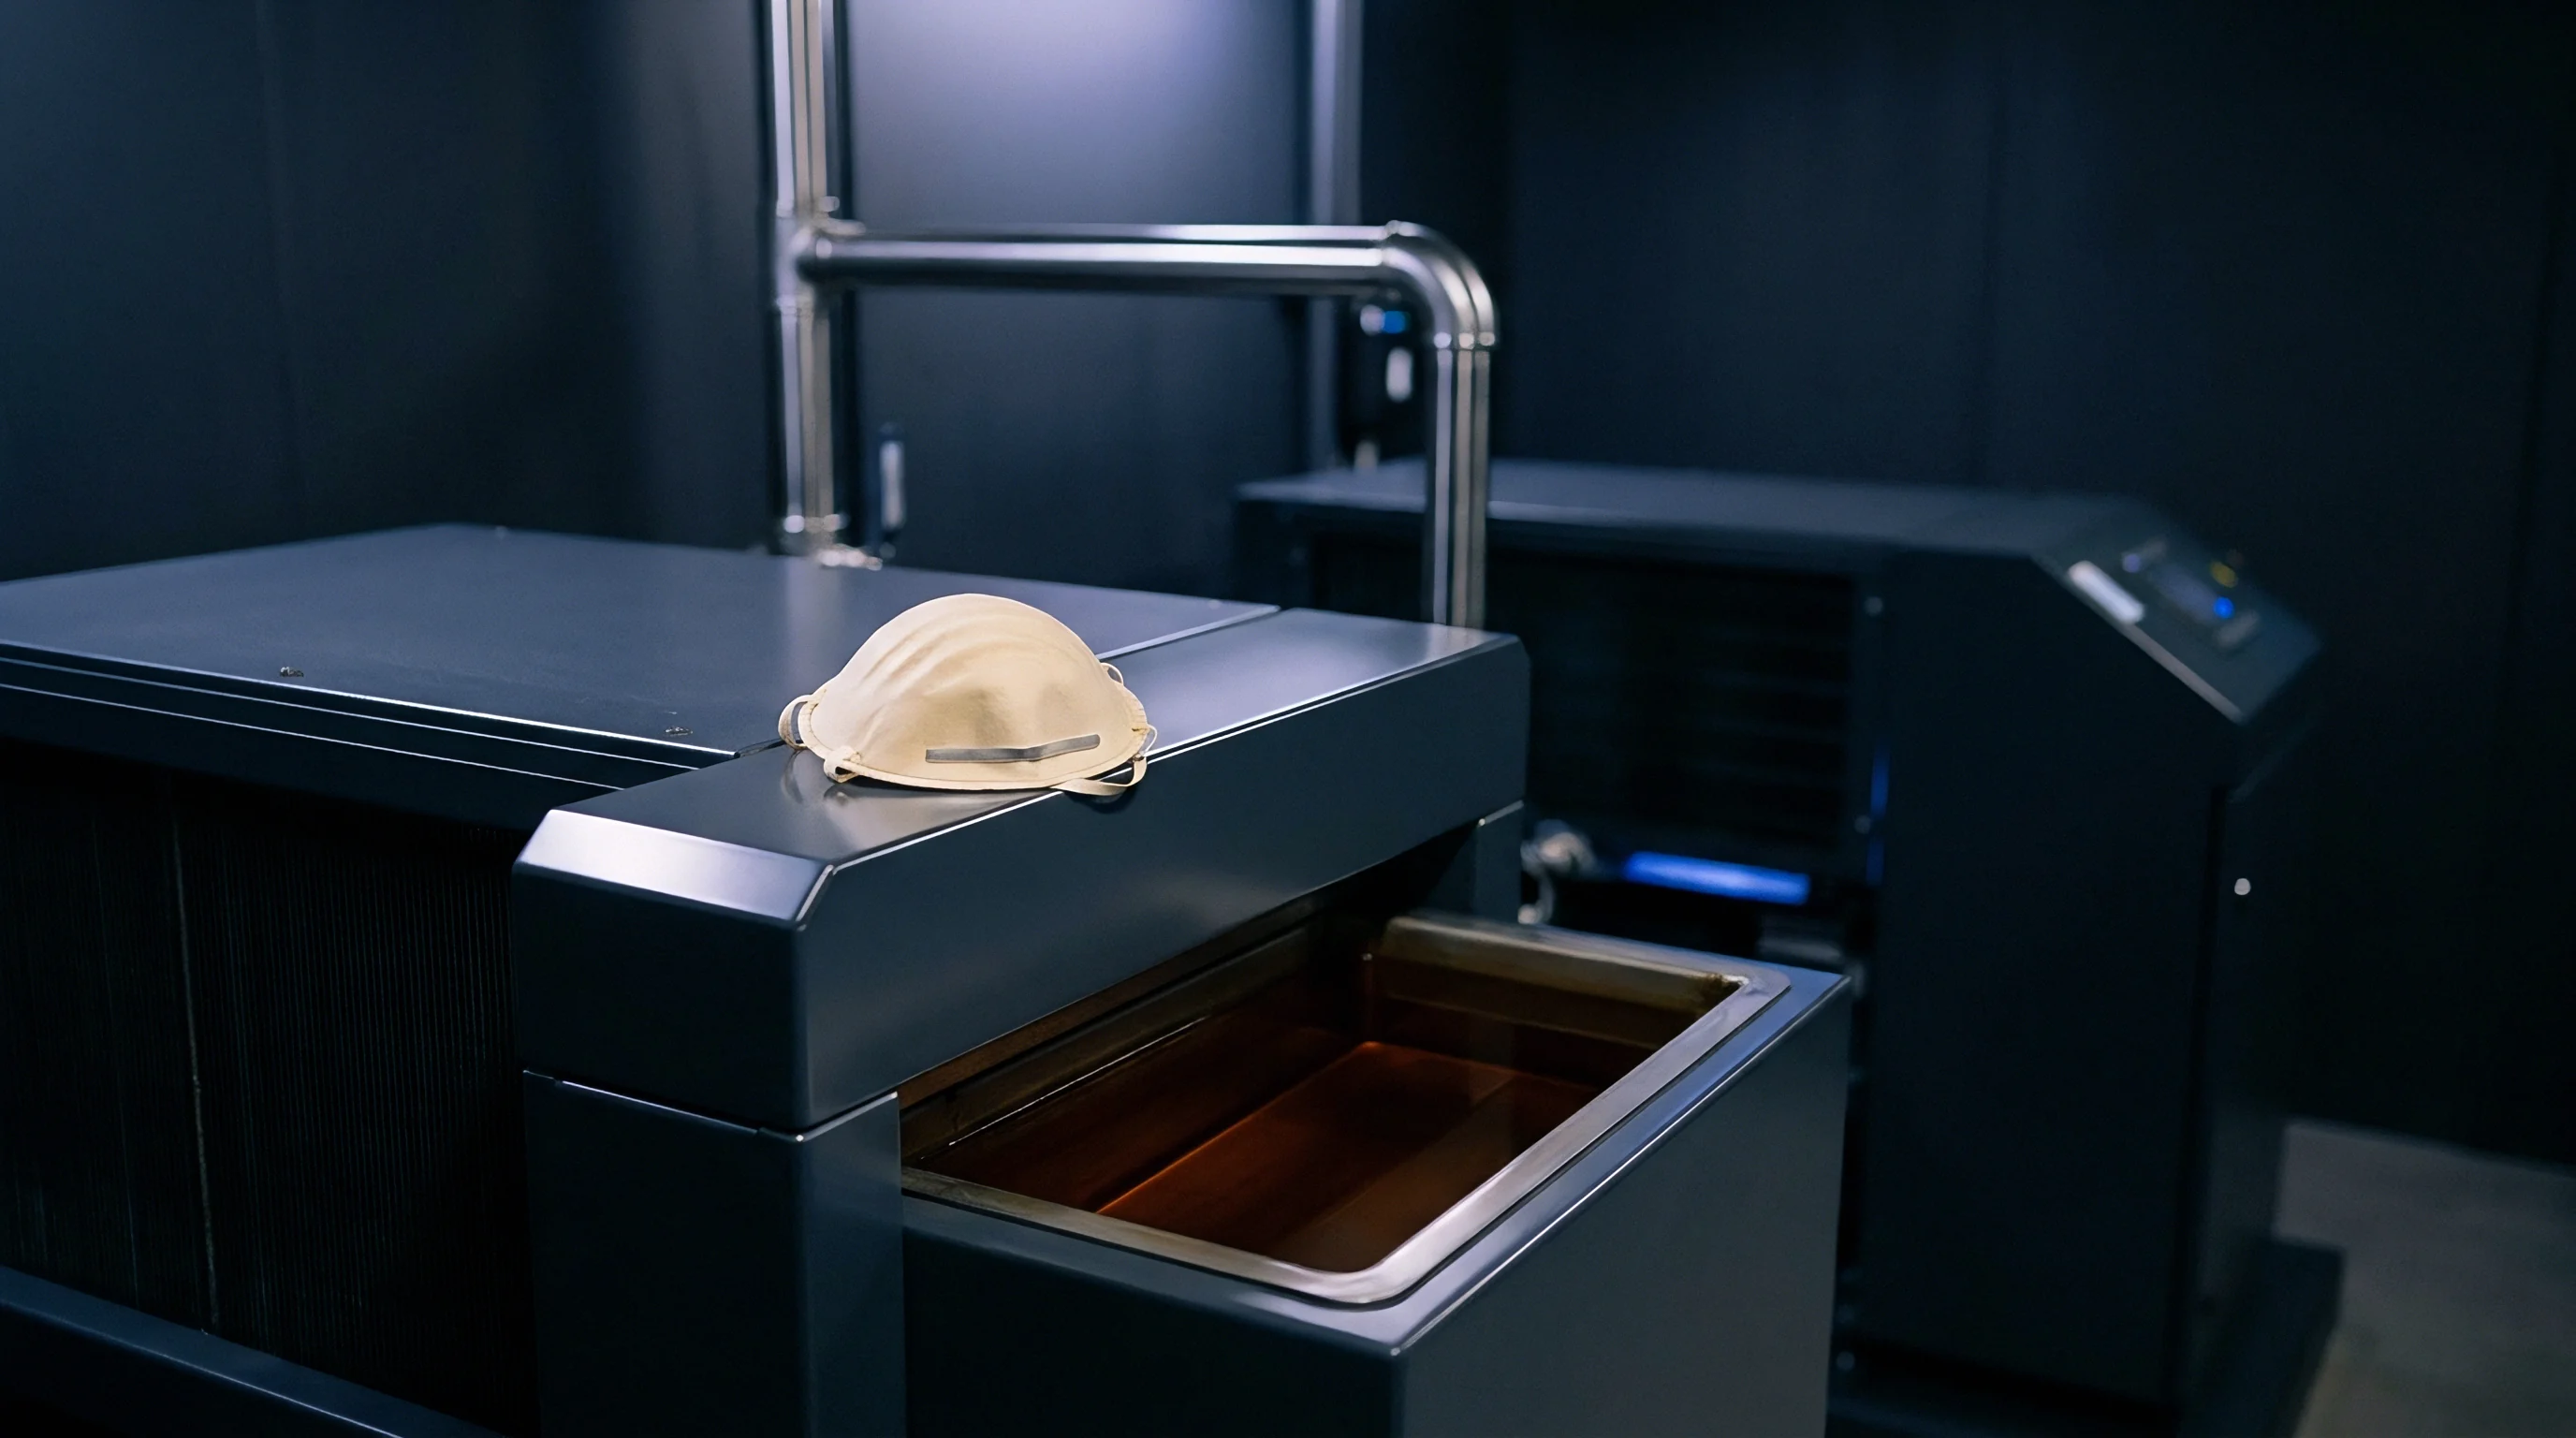
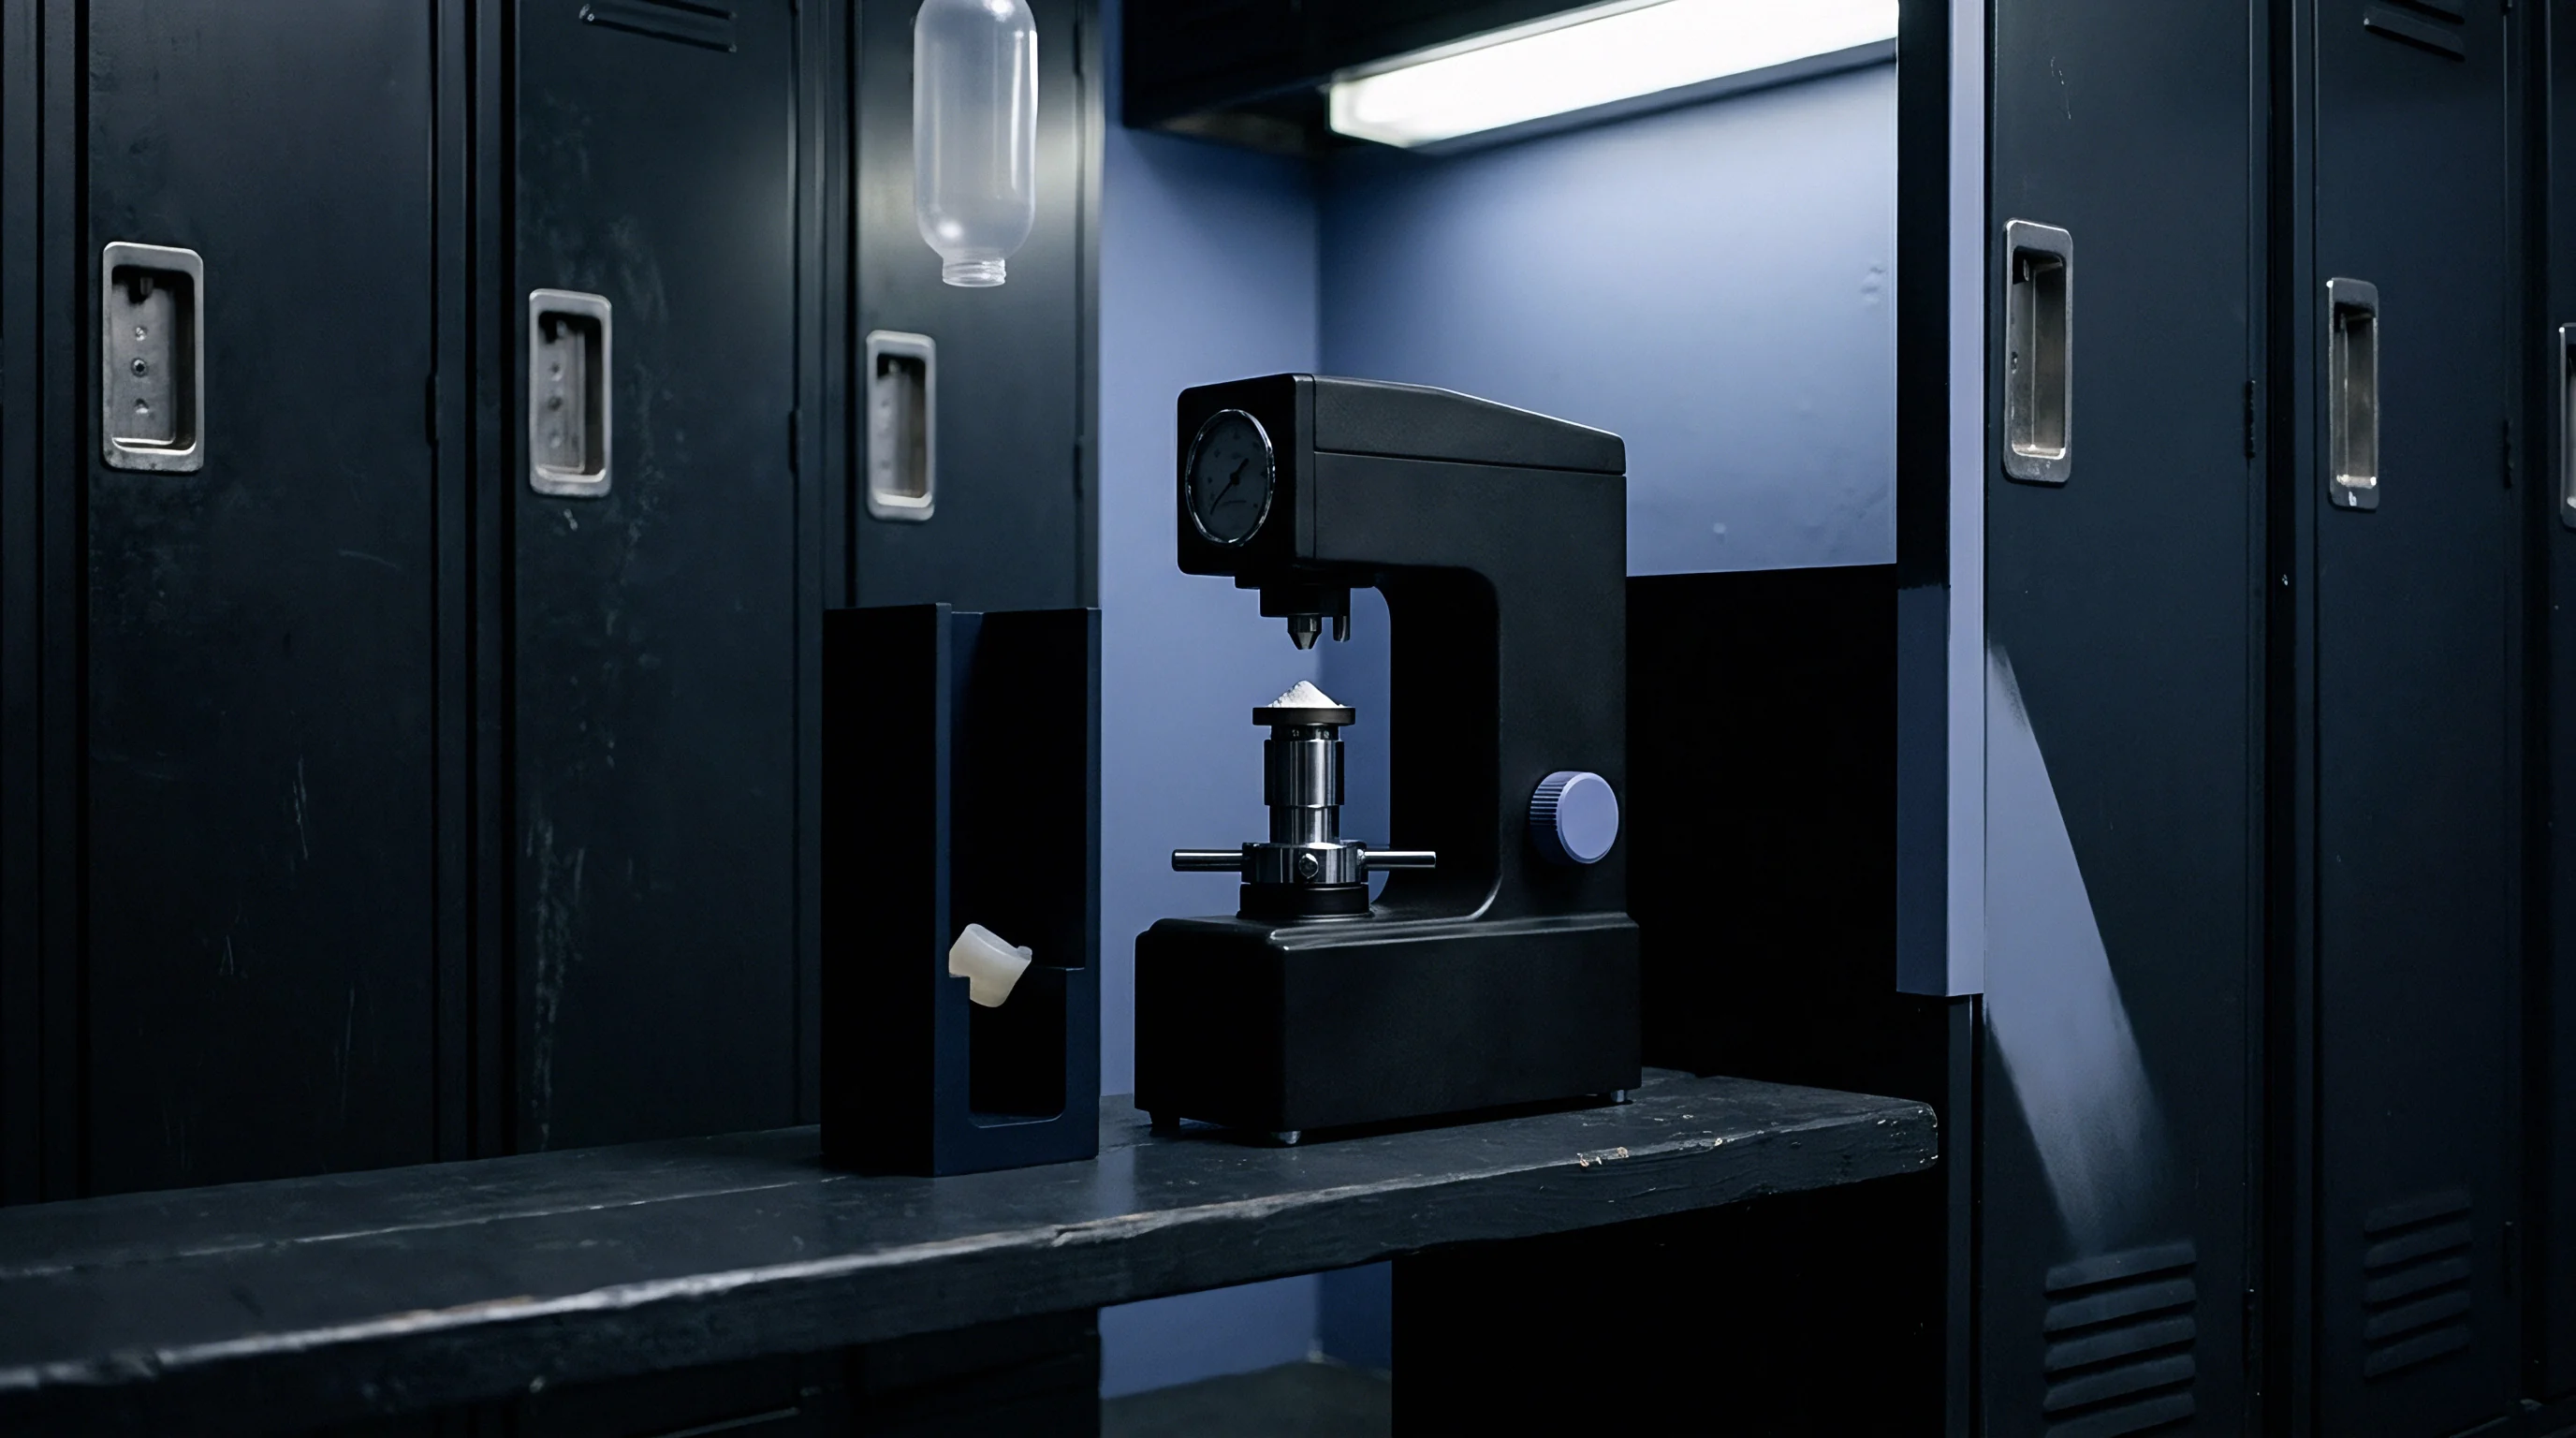
Bath
Thermostatic liquid containers form the mechanical foundation of hydrostatic immersion testing. Maintaining constant liquid temperatures inside testing vessels prevents convection currents from disturbing balance suspension wires while preserving known fluid density values. When testing solid polymer samples under ISO 1183-1 Method A, thermal fluctuations within the liquid bath generate subtle buoyancy changes that distort analytical results.
Precision thermostatic baths employ dual-wall insulation, continuous magnetic stirring, and proportional-integral-derivative heating element controllers to hold fluid temperatures within ±0.05 °C of the standard 23.0 °C reference baseline.
Pure water serves as the universal reference liquid in hydrostatic weighing due to thoroughly documented density-temperature tables published by international metrology organizations. However, untreated water exhibits a high surface tension of approximately 72.8 mN/m at 23 °C. When a dry polymer pellet enters the water bath, air bubbles readily adhere to hydrophobic polymer surfaces such as polypropylene or polyethylene. A single micro-bubble with a diameter of 0.5 millimeters introduces a buoyant volume error of 0.000065 cubic centimeters.
For a small specimen weighing 0.5 grams, this tiny bubble understates the measured sample density by nearly 0.0012 g/cm³, displacing a compliant resin across official classification boundaries.

Surfactant Concentration and Interfacial Tension Control
Adding surface-active agents to distilled water reduces liquid-solid contact angles, encouraging fluid wetting across hydrophobic polymer surfaces. ISO 1183-1 permits the addition of non-ionic surfactants, such as Triton X-100 or alkylphenol ethoxylates, at concentrations not exceeding 0.1% by volume. Surfactant addition depresses water surface tension below 30 mN/m, forcing clinging air bubbles to detach spontaneously from pellet surfaces upon submersion.
Over-dosing surfactants alters the fundamental density of the immersion liquid, invalidating standard distilled water density tables. Laboratory personnel measure surfactant additive concentrations using precision volumetric pipettes, verifying the resulting liquid mixture density with a calibrated glass pycnometer before commencing sample testing. A 1.5 °C temperature shift alters calculated density by 0.0003 g/cm³, demonstrating why continuous fluid temperature monitoring remains essential during border verification routines.
Alternative immersion liquids become mandatory when testing water-soluble polymers like polyvinyl alcohol or highly hygroscopic materials like polyamide 6,6. Iso-octane, n-heptane, and low-viscosity silicone oils present suitable non-solvating media for sensitive polymers. These organic solvents display lower surface tension than pure water, reducing air bubble attachment naturally without requiring surfactant additions.
However, organic solvents display significantly higher thermal expansion coefficients than water, demanding stricter thermal stabilization inside the liquid enclosure.

Does Immersion Liquid Temperature Control Alter Classification Boundaries?
Thermal fluctuation within test fluids directly shifts measured specific gravity readouts across sensitive tariff divisions. Standard polyolefins undergo volumetric expansion as temperature rises, following characteristic volumetric thermal expansion coefficients between (2.0 times 10^{-4} text{ K}^{-1}) and (3.5 times 10^{-4} text{ K}^{-1}). Simultaneously, the surrounding immersion fluid undergoes thermal expansion, altering its density according to known thermodynamic state equations.
Uncontrolled heating inside laboratory testing rooms causes non-linear divergence between solid specimen volume and liquid displaced volume.
The table below summarizes physical properties, density values, and temperature sensitivity parameters for common immersion liquids utilized in ISO 1183 testing across standard laboratory temperature windows:
| Immersion Fluid | Density at 20.0 °C (g/cm³) | Density at 23.0 °C (g/cm³) | Density at 25.0 °C (g/cm³) | Thermal Coefficient (g/cm³/°C) |
|---|---|---|---|---|
| Distilled Water (Pure) | 0.99820 | 0.99756 | 0.99705 | -0.00023 |
| Water + 0.05% Triton X-100 | 0.99823 | 0.99759 | 0.99708 | -0.00023 |
| n-Heptane (Analytical) | 0.68370 | 0.68115 | 0.67945 | -0.00085 |
| Ethanol (Absolute) | 0.78934 | 0.78675 | 0.78502 | -0.00086 |
| Silicone Oil (5 cSt) | 0.91800 | 0.91560 | 0.91400 | -0.00080 |
| Data compiled from international standard metrology tables and ISO 1183-1 reference calibration guidelines at standard atmospheric pressure. | ||||
Customs laboratory inspectors operating in warm or tropical regions without continuous air conditioning face systemic measurement drift. Testing high-density polyethylene pellets at 26.5 °C using a density value intended for 23.0 °C introduces severe analytical bias. The higher liquid temperature expands both the water and the polyolefin pellet, altering the buoyant force balance on the balance arm.
Unless automated electronic balances integrate continuous fluid temperature probe feedback to correct the liquid density term dynamically, the reported polymer density deviates from true values by up to 0.0008 g/cm³.
Border compliance testing demands rigorous validation of thermostatic bath stability prior to logging official measurements. Thermocouples and glass thermometers require annual calibration against national measurement standards to maintain legal traceability. When customs authorities challenge an importer’s declared Harmonized System entry code based on hydrostatic balance data, documented proof of thermostatic bath calibration serves as the primary technical defense against misclassification notices.
A density shift of 0.0020 g/cm³ at 23.0 °C moves low-density polyethylene across the customs threshold into medium-density tariff classifications.
Failing to compensate for temperature variation in immersion fluids distorts laboratory mass readouts, exposing importers to administrative back-duty claims and customs penalty seizures.

Column
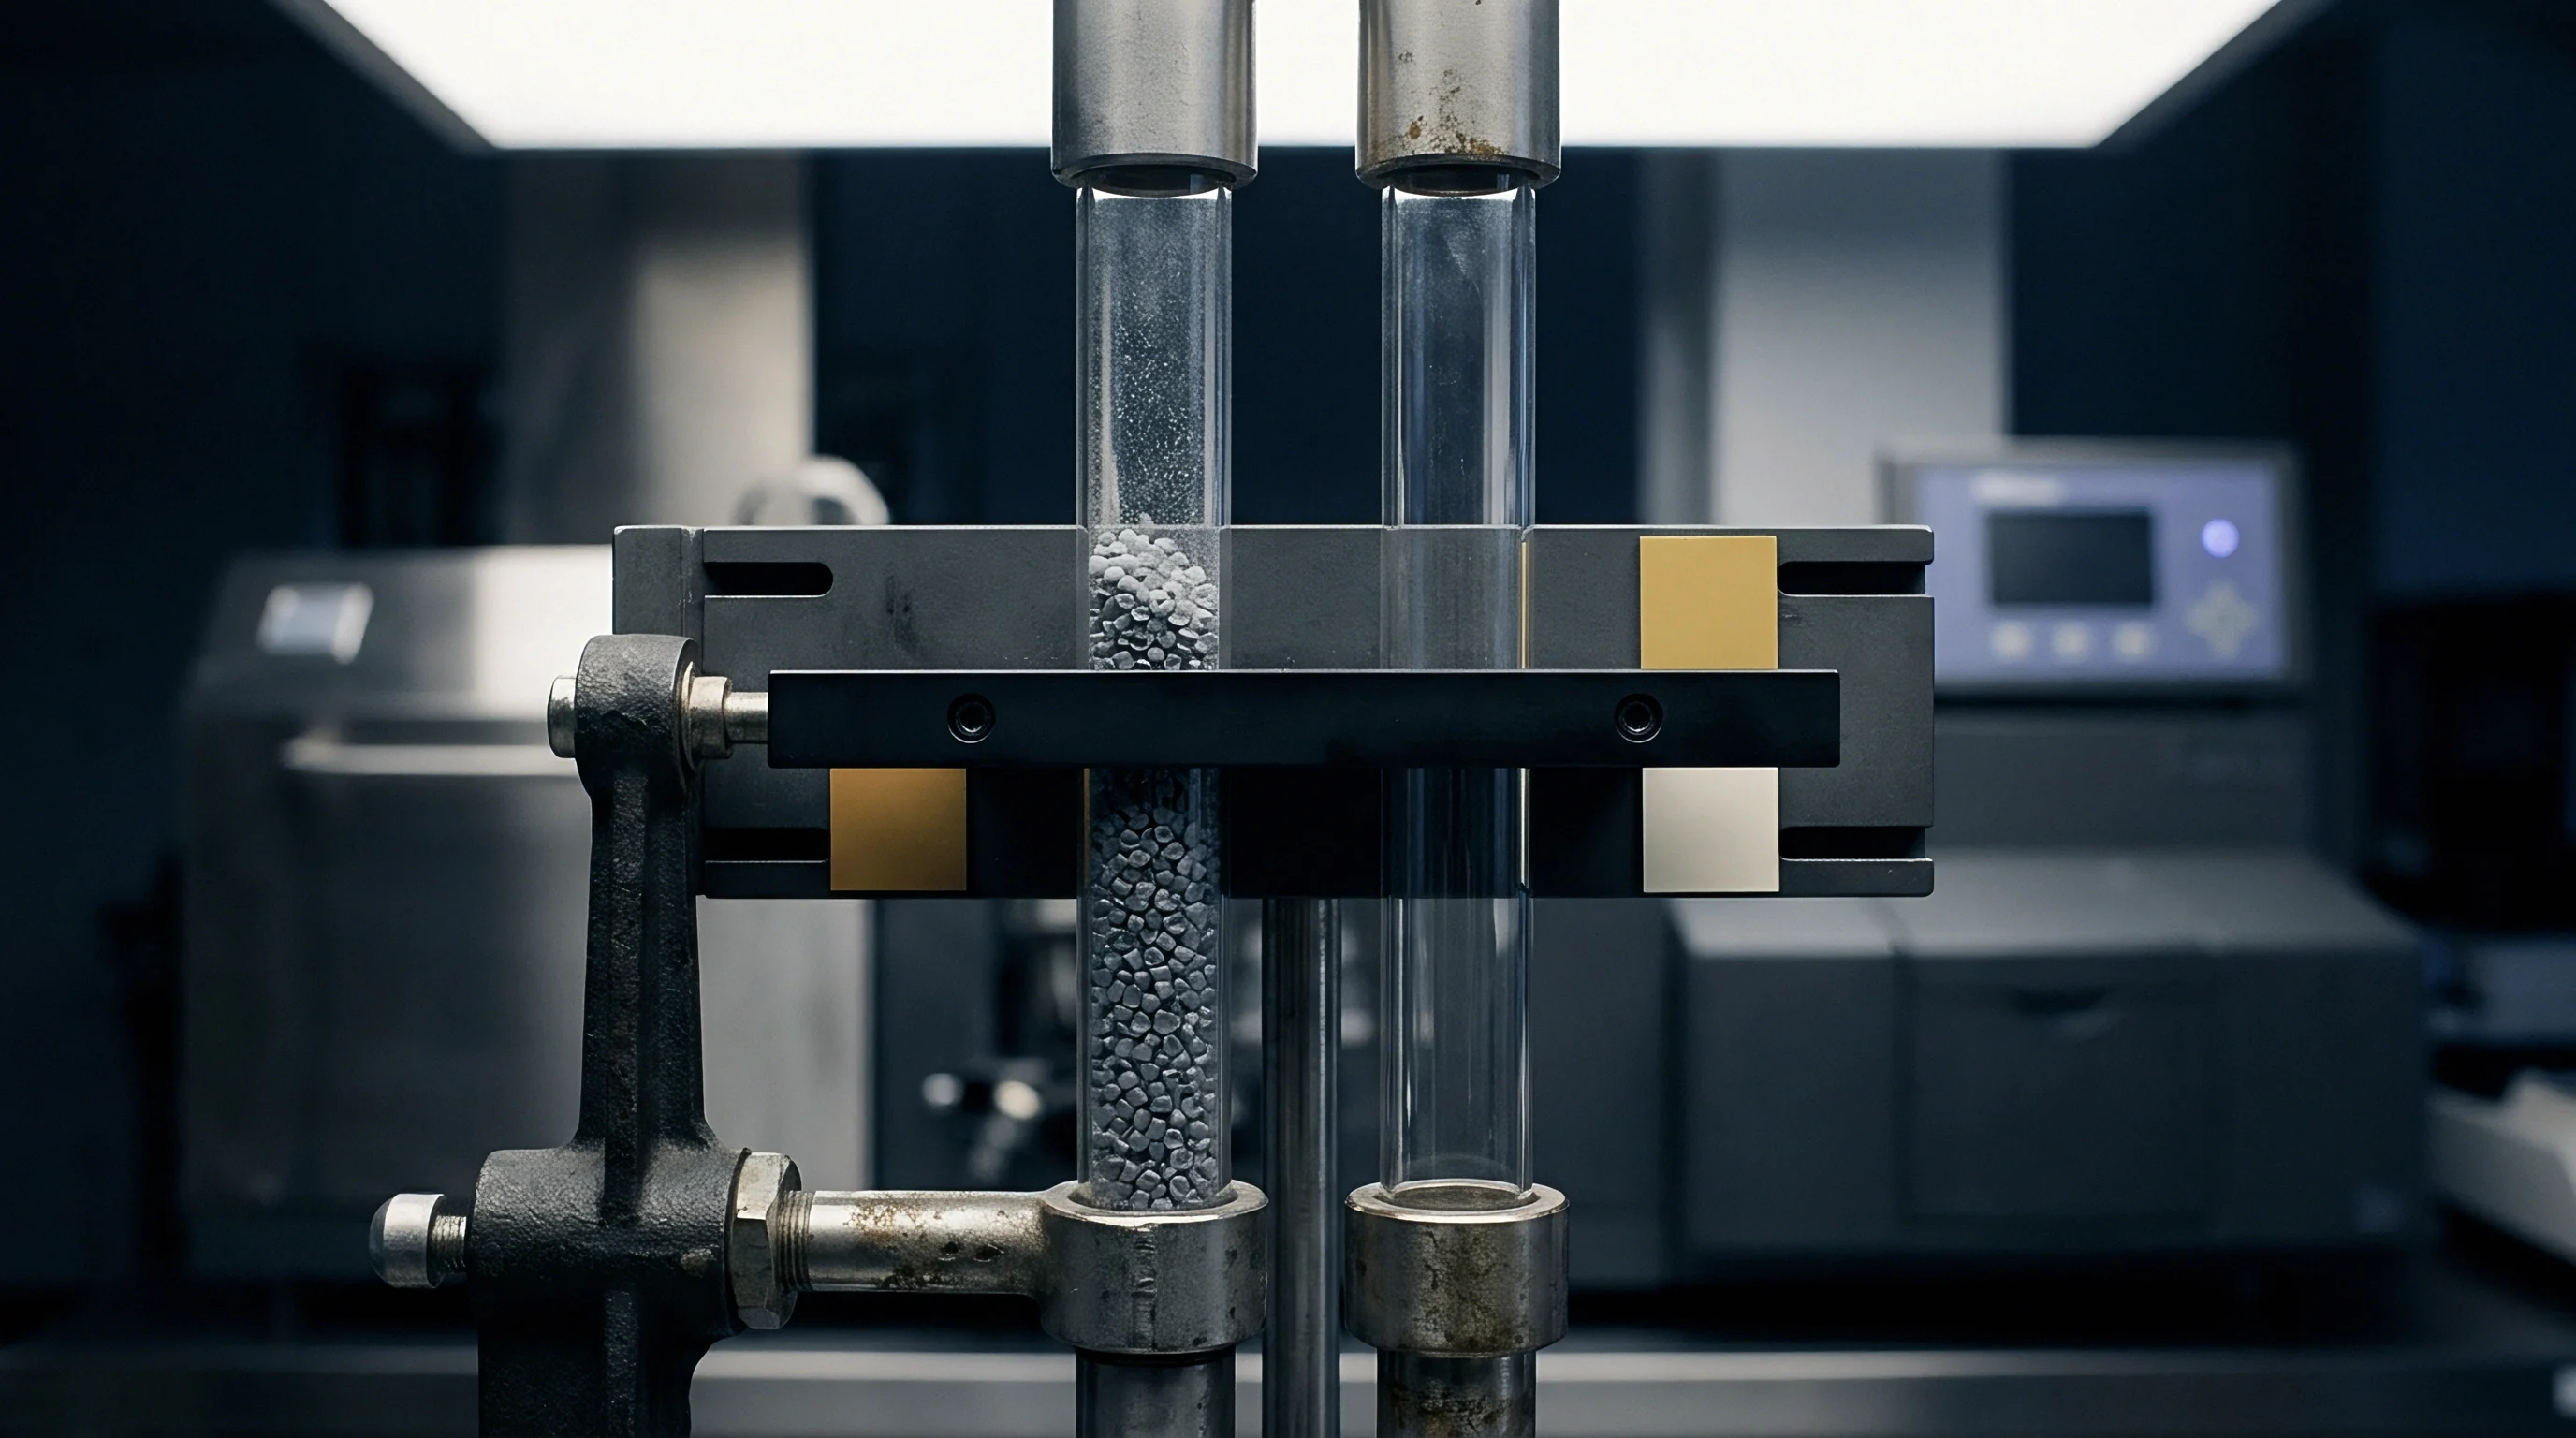
Vertical glass tubes filled with miscible fluids establish continuous buoyancy environments for solid polymer samples. ISO 1183-2 standardizes the density gradient column technique, providing a physical method capable of resolving density differences down to 0.0001 g/cm³. While hydrostatic balances weigh individual specimens one by one, a gradient column allows concurrent measurement of multiple polymer pellets, regrind flakes, or micro-molded parts in a single fluid vessel.
Constructing stable fluid density distributions requires precise volumetric blending of light and heavy solvent phases. A heavy liquid, such as a dense aqueous zinc chloride solution or isopropyl alcohol-water mixture, fills the bottom of the tall glass column. A lighter liquid, such as pure water or ethanol, occupies the top section.
A dual-flask filling apparatus gradually transfers light liquid into a stirred heavy liquid reservoir while pumping the resulting mixture into the column base. This concentration shift establishes a continuous, linear density gradient from top to bottom along the glass tube length.
Gradient Media Preparation and Glass Float Calibration
Standardized glass floats of known mass and volume calibrate spatial density coordinates along the vertical axis of the column. Glass float spheres, sealed under vacuum with calibrated internal metal weights, carry certified density values assigned by national standards laboratories to four decimal places. When dropped into a newly prepared gradient column, each float sinks until reaching a depth where its overall density matches the local fluid mixture density precisely.
Uncalibrated floats introduce systematic errors into float positioning curves. A cathetometer or optical scale measures the exact vertical equilibrium height of each reference float relative to a fixed baseline at the tube bottom. Plotting float height against certified float density yields a linear calibration curve.
Interpolating the settling height of an unknown polymer pellet along this calibration line establishes the specimen density without balance weighing steps.
The following numbered operational sequence defines the standard setup and calibration protocol for ISO 1183-2 density gradient columns:
- Fill the primary gradient mixing vessel with heavy liquid mixture while maintaining constant temperature regulation at 23.0 °C.
- Siphon light liquid into the mixing chamber under magnetic stirring to build a linear density profile inside the vertical tube.
- Gently lower calibrated glass floats spanning the target density range into the liquid gradient using a wire basket.
- Allow the vertical gradient system to thermalize for at least twelve hours inside a jacketed temperature bath.
- Measure float position coordinates with a cathetometer to plot the linear calibration curve before introducing test pellets.
Gradient columns require complete isolation from mechanical vibrations and ambient thermal gradients. Building heating systems, sunlight exposure, or physical bumps induce free convection currents inside the column, destroying the linear liquid density profile. Specialized jacketed glass columns circulate constant-temperature water through an outer jacket enclosure, holding internal column temperatures within ±0.02 °C. Air bubbles adhering to glass column walls must be removed with a flexible glass rod prior to introducing calibration floats or test specimens.
Equilibrium Drift and Thermal Gradient Stabilization
Long-term ambient temperature fluctuations introduce convective currents within liquid columns. As fluid density profiles age, slow molecular diffusion between light and heavy liquid layers causes the linear gradient slope to flatten, particularly near the top and bottom tube boundaries. Daily recalibration checks using reference glass floats monitor gradient stability, confirming whether the cathetometer calibration curve remains valid for incoming customs sample evaluations.
Specimen immersion kinetics play a decisive role in density gradient accuracy. Solid polymer pellets dropped into the column require sufficient time to reach terminal buoyant equilibrium, typically resting between one and three hours depending on fluid viscosity and particle size. Surfactant pre-wetting prevents micro-bubbles from riding down pellet surfaces into the column.
Hydrophobic polyolefin pellets that carry microscopic surface bubbles remain artificially buoyant, coming to rest higher up in the tube and registering an artificially low density value.
When testing semi-crystalline resins like polyethylene terephthalate, specimen physical preparation impacts gradient column performance. Pellets cut with rough shear blades exhibit micro-fraying along edges, trapping microscopic air bubbles that alter settling depth. Fine scalpel sectioning generates smooth-walled specimens that achieve precise fluid immersion equilibrium without bubble artifacts.
Lower density test figures can stem from ambient laboratory draft disturbance or unannounced monomer ratio shifts during polymerization.

Code
Customs authorities classify primary plastics within Chapter 39 of the Harmonized Commodity Description and Coding System using physical property thresholds. Density determinations carried out under ISO 1183 standards serve as legally binding evidence to assign six-digit subheadings for polyolefins, polyesters, and filled polymer compounds. A shift as small as 0.001 g/cm³ can alter the applicable tariff schedule, moving a product from a low-tariff raw resin line into a higher-rated specialty plastic heading.
Importers, trade attorneys, and compounding practices rely on exact analytical testing to substantiate declared tariff codes during customs border audits.
Chapter 39 Legal Note 6 and sub-heading notes define specific gravity thresholds for polyethylene and polypropylene resins. In customs jurisprudence, specific gravity measured at 23.0 °C corresponds directly to relative mass density compared against water. Polyethylene resins fall into distinct six-digit tariff categories based on whether their natural, uncompounded matrix density lies below or above 0.940 g/cm³ at 23.0 °C. Inorganic fillers increase compound density.
Polyethylene Specific Gravity Boundaries in Harmonized Tariff Schedules
Subheading 3901.10 applies to ethylene polymers possessing relative mass values below 0.940. This category encompasses low-density polyethylene produced via high-pressure autoclave or tubular processes, linear low-density polyethylene copolymerized with hexene or octene, and very-low-density polyethylenes. Subheading 3901.20 governs polyethylene displaying a specific gravity of 0.940 or greater.
This heading includes medium-density polyethylene and high-density polyethylene synthesized via Ziegler-Natta or metallocene catalysis systems.
Customs rules evaluate density on the base polymer prior to adding functional additives, pigments, or heavy mineral fillers, unless the imported product constitutes a fully compounded ready-to-mold masterbatch. If a compounder adds 3% calcium carbonate filler to a base LLDPE resin possessing a natural density of 0.918 g/cm³, the resulting filled compound exhibits a measured density of approximately 0.941 g/cm³. If declared under 3901.10 based on the base resin datasheet, customs inspectors applying ISO 1183-1 testing to the incoming pellets will measure 0.941 g/cm³, issue a formal reclassification notice under 3901.20, and demand back duties plus administrative penalties.
The duty differential between 3901.10 and 3901.20 varies significantly across global economic jurisdictions. Under European Union TARIC schedules, United States Harmonized Tariff Schedules, and regional trade frameworks, rate disparities between polyethylene subheadings encourage intense customs scrutiny of borderline shipments. Border audits demand rigorous documentation.

Polypropylene Copolymer Mass Fractions and Specific Mass Limits
Subheading 3902.10 covers unmodified propylene homopolymers with characteristic density values between 0.895 g/cm³ and 0.915 g/cm³. Propylene-ethylene random copolymers and impact copolymers fall under subheading 3902.30, provided that the propylene monomer mass fraction equals or exceeds 50% of total polymer weight. Identifying polypropylene copolymers via density alone presents technical challenges, as incorporating ethylene comonomer units drops overall polymer crystallinity and shifts matrix density downward toward 0.890 g/cm³.
When evaluating suspected propylene-ethylene impact copolymers, customs laboratories combine ISO 1183 density testing with nuclear magnetic resonance spectroscopy or differential scanning calorimetry under ISO 11357. The density value acts as a primary screening metric: a polypropylene sample displaying a density below 0.900 g/cm³ accompanied by multiple melting endotherms strongly indicates a copolymer structure falling under 3902.30 rather than a homopolymer under 3902.10.
The table below provides a comprehensive operational guide linking Harmonized System tariff codes, density thresholds, chemical classifications, and critical ISO testing conditions across major industrial thermoplastic resins:
| Harmonized Code | Polymer Description | Density Threshold (g/cm³) | Governing Test Standard | Tariff Classification Impact |
|---|---|---|---|---|
| HS 3901.10 | Polyethylene (Low Density) | < 0.940 at 23.0 °C | ISO 1183-1 Method A | Standard polyolefin rate; covers LDPE, LLDPE, VLDPE |
| HS 3901.20 | Polyethylene (High Density) | ≥ 0.940 at 23.0 °C | ISO 1183-1 Method A | Higher ad valorem duty in select regions; covers HDPE |
| HS 3902.10 | Polypropylene (Homopolymer) | 0.895 to 0.915 at 23.0 °C | ISO 1183-1 or ISO 1183-2 | Base polypropylene tariff line; uncompounded resin |
| HS 3902.30 | Propylene Copolymers | 0.885 to 0.905 at 23.0 °C | ISO 1183-1 + NMR/DSC | Copolymer classification; requires monomer mass proof |
| HS 3907.61 | PET (Viscosity Number ≥ 78) | 1.330 to 1.400 at 23.0 °C | ISO 1183-1 Method B / ISO 307 | Bottle-grade PET resin; strict IV and density rules |
| HS 3907.69 | PET (Other Grades) | 1.330 to 1.380 at 23.0 °C | ISO 1183-1 Method B | Textile and film grade PET; lower intrinsic viscosity |
Thermal History and Crystallinity Modulation in Polyester Classifications
Polyethylene terephthalate resin properties vary dramatically based on processing conditions and structural ordering. Amorphous PET pellets produced during rapid melt quenching exhibit an unordered molecular matrix with a lower density of approximately 1.333 g/cm³. Thermally annealed, semi-crystalline PET bottle resins display ordered folded-chain lamellae, elevating bulk density to between 1.380 g/cm³ and 1.400 g/cm³.
Customs heading 3907.61 differentiates high-viscosity bottle resins from lower-viscosity textile grades under 3907.69 using a combination of density testing and solution intrinsic viscosity measurements.
The degree of polymer crystallinity (X_c) links directly to measured sample density (rho) through two-phase mass balance equations:
Xc = left( fracρ – ρaρc – ρa right) · left( fracρcρ right) · 100%
In this relationship, (rho_a) represents the density of completely amorphous polymer (1.333 g/cm³ for PET), and (rho_c) represents the theoretical density of 100% crystalline polymer unit cells (1.455 g/cm³ for PET).
Evaluating how inorganic mineral masterbatches shift density readings and trigger tariff reclassification relies on the mass balance equations governing filled polyolefin compounds. Consider a natural high-density polyethylene base resin with a density of 0.952 g/cm³. A masterbatch producer compounds this resin with calcium carbonate ((CaCO_3), theoretical density 2.710 g/cm³) to yield an opaque white film compound.
The overall density of the two-phase compound (rho_c) follows the volumetric mixture rule:
frac1ρc = fracwmρm + fracwfρf
Where (w_m) and (w_f) are the mass fractions of matrix polymer and inorganic filler, while (rho_m) and (rho_f) are their respective component densities. The table below illustrates how progressive calcium carbonate loading alters compound density, demonstrating how low filler concentrations alter classification lines:
Calculating compound density across increasing filler weight fractions shows exact transition points:
- Unfilled Resin Base (0.0% filler): Matrix mass fraction 1.000, compound density equals 0.9520 g/cm³, classified under HS 3901.20.
- Low Mineral Loading (2.0% filler): Matrix mass fraction 0.980, calculated compound density reaches 0.9678 g/cm³, remaining within HS 3901.20.
- Medium Mineral Loading (5.0% filler): Matrix mass fraction 0.950, calculated compound density reaches 0.9923 g/cm³, approaching water buoyancy limits.
- High Masterbatch Loading (20.0% filler): Matrix mass fraction 0.800, calculated compound density climbs to 1.1328 g/cm³, shifting entry into filled composite categories under HS 3901.90 or general chemical headings.
Importers verifying declared HS codes must evaluate filler loadings carefully before submitting entry documentation. Applying ISO 1183 density testing to incoming resin lots identifies unauthorized formulation adjustments, ensuring customs classification declarations remain technically sound.
The decision checklist below outlines required technical documentation steps for cross-border customs tariff verification:
- Certificate Analysis Verification matches reported ISO 1183 test methods and measurement temperatures against physical pellet sample shipments.
- Molded Plaque Preparation eliminates internal pellet void artifacts by compression molding samples under standardized ISO 293 cooling rates.
- Filler Content Quantification measures inorganic ash residue under ISO 3451 to decouple mineral loading effects from base polymer matrix density.
- Accredited Re-Testing Audits execute dual-laboratory hydrostatic weighings under ISO 17025 accredited quality management protocols.
Pigmented virgin pellets sink faster in buoyant media when inorganic colorants exceed natural resin baseline concentrations.
Virgin polyolefin resins containing heavy metal colorants or mineral slip agents consistently register higher mass values than unpigmented polymer feedstocks.

Void
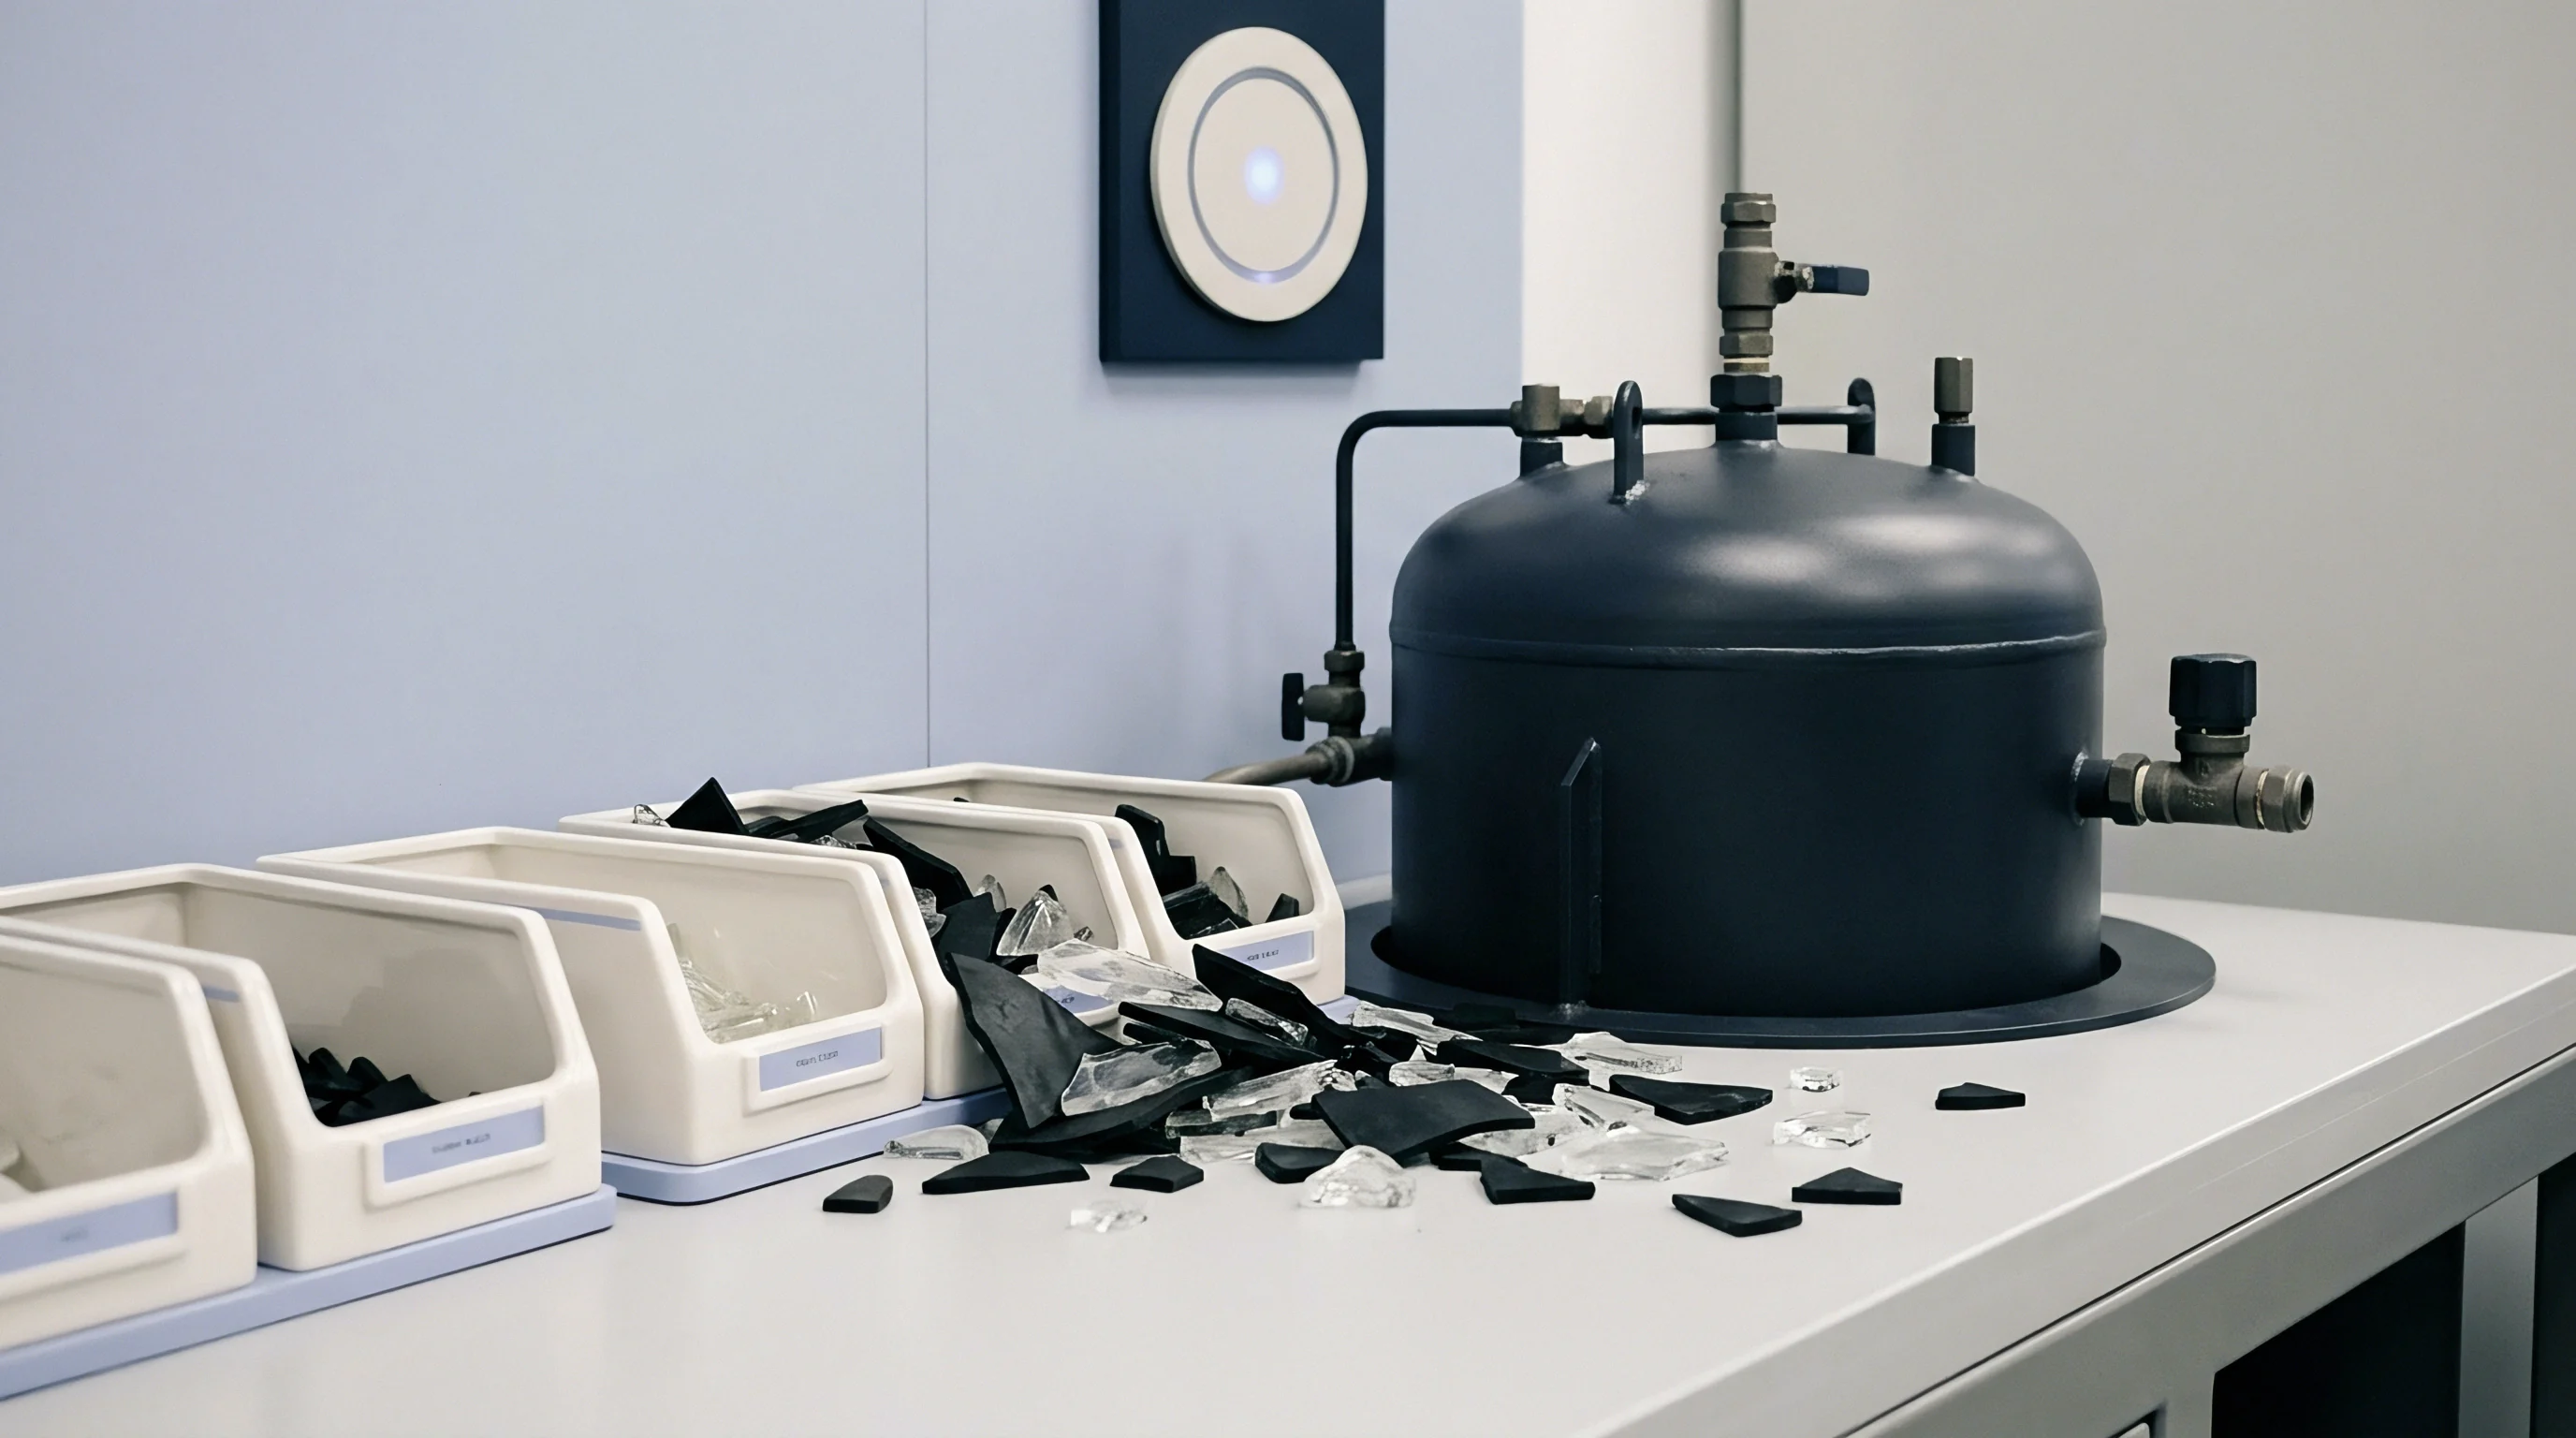
Structural hollows inside pelletized resin granules distort Archimedean buoyancy measurements by trapping air within the particle core. Underwater pelletization lines operating at high throughput rates occasionally introduce internal thermal shrinkage cavities as molten polymer strands cool rapidly in cold water streams. The outer pellet surface freezes instantly, forming a rigid outer shell while the molten interior continues to shrink.
The resulting internal gas space remains hermetically sealed, containing low-pressure vapor or vacuum pockets that cannot be penetrated by liquid immersion media during testing under ISO 1183-1.
When an operator submerges an intact pellet containing internal hollows into a hydrostatic balance liquid bath, the measured displacement reflects total particle volume rather than true solid resin matrix volume. The trapped air void increases apparent sample displacement without contributing measurable mass. Consequently, the calculated density drops below the true polymer matrix value according to the following error relationship:
$$rho_{apparent} = frac{m_{solid}}{V_{solid} + V_{void}}
An internal void fraction of just 1.5% by volume drops a high-density polyethylene pellet matrix from a true density of 0.942 g/cm³ down to an apparent density of 0.928 g/cm³. If tested solely as intact pellets, a customs laboratory will classify the material under subheading 3901.10 as low-density polyethylene, contradicting the true 3901.20 high-density polymer structure.
Internal Shrinkage Cavities and Pellet Occlusion Effects
Rapid outer surface cooling during underwater pelletization traps low-pressure gas bubbles within particle interiors. High-density polyethylene, polypropylene, and polyester resins display significant volumetric thermal shrinkage during phase change, exacerbating micro-void formation. Cryo-milling pellets into fine granules or pressing pellets into solid, air-free plaques via compression molding under ISO 293 eliminates internal void artifacts entirely.
Placing intact pellets into gas pycnometers under ISO 1183-3 fails to solve internal closed-void errors. Because helium gas cannot pass through sealed solid polymer walls during brief test cycles, the pycnometer records particle volume including closed internal pores. Gas pycnometry eliminates void errors only when sample particles are cut or ground to dimensions smaller than the average internal bubble diameter, opening closed pores to helium gas entry.
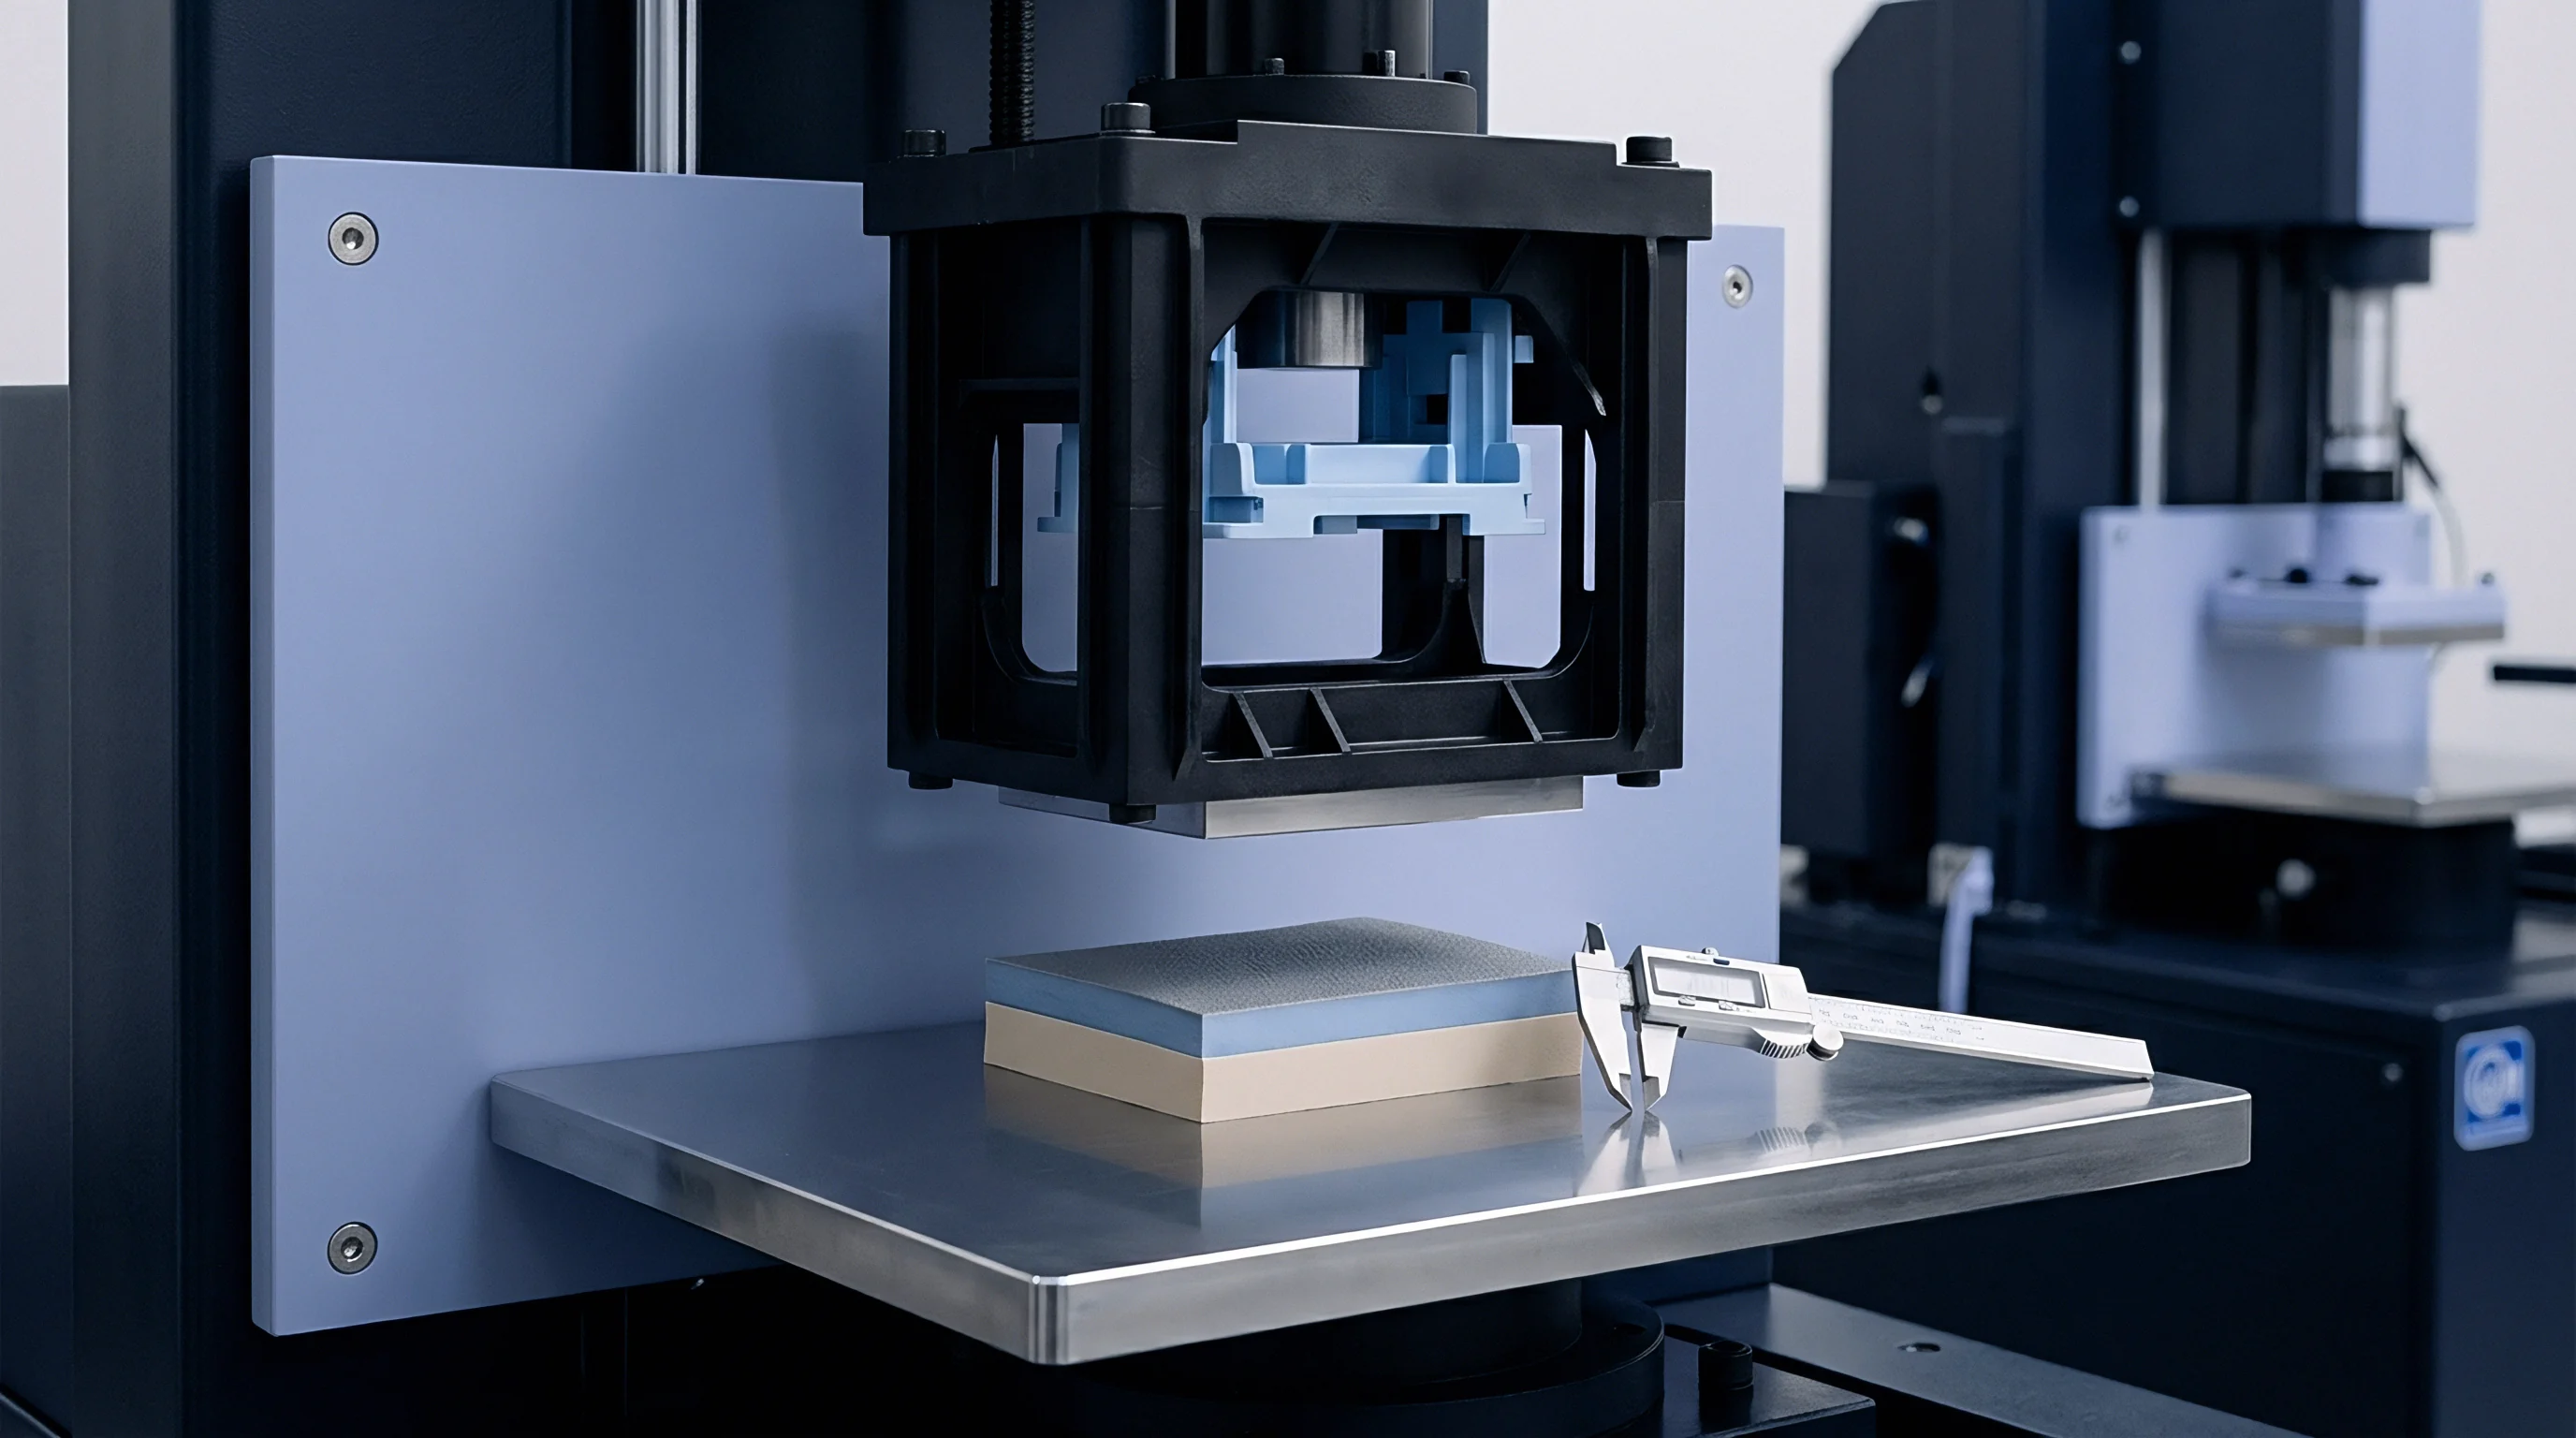
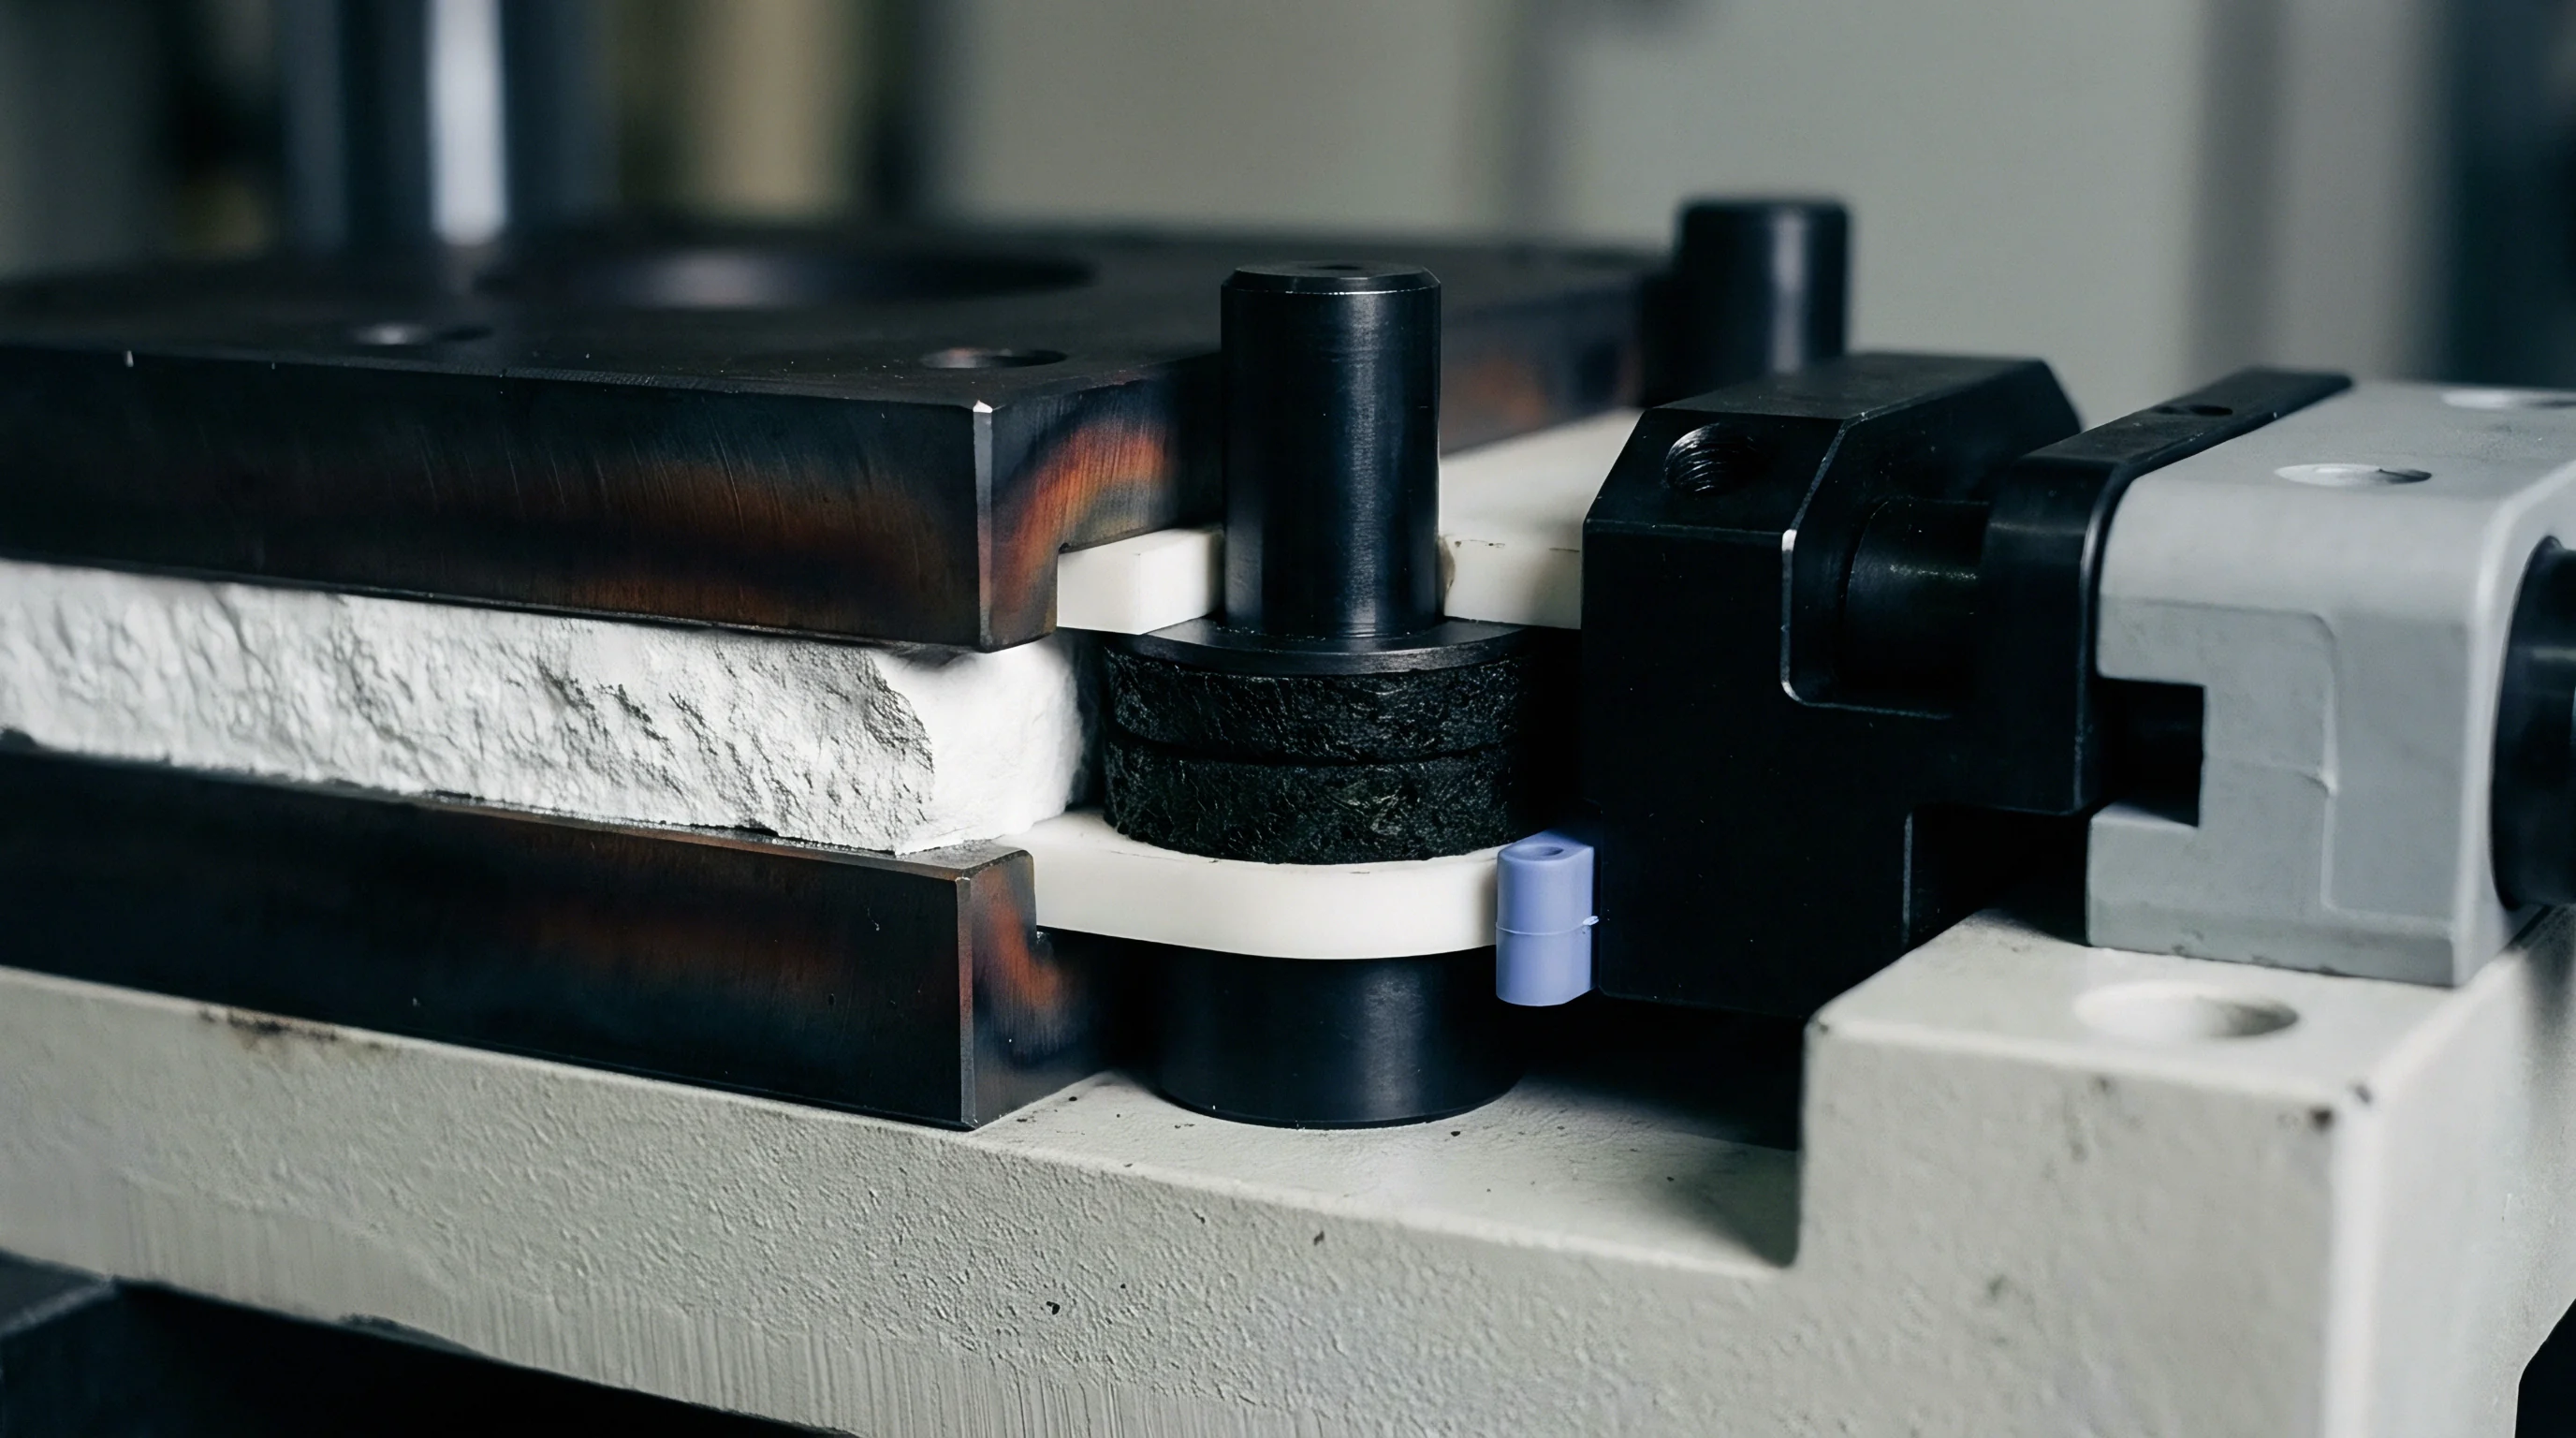
To prevent internal voiding errors during customs verification disputes, standard protocols mandate preparing solid, void-free plaques prior to density measurement. Pellets undergo melt compression molding inside a heated hydraulic press at specified temperatures, followed by controlled cooling under pressure according to ISO 293 or ISO 1872-2 guidelines. Specimens cut from the resulting homogeneous plaque carry zero internal voiding, yielding true polymer matrix density readouts that reflect intrinsic chemical structure.

Hygroscopic Moisture Uptake and Pre-Test Vacuum Drying
Polyamide and polyester resins absorb atmospheric water vapor until reaching equilibrium moisture content. Moisture absorption increases sample mass without causing a proportional increase in physical volume, elevating measured density values. Nylon 6 pellets stored in humid ambient air absorb up to 3.5% water by weight, shifting measured density from a dry matrix baseline of 1.130 g/cm³ up to 1.155 g/cm³.
ISO 1183 testing requires pre-test thermal conditioning to standardize moisture levels in hygroscopic plastics. Standard conditioning protocols under ISO 291 store test specimens at 23.0 °C ± 1.0 °C and 50% ± 5% relative humidity for 24 to 48 hours prior to weighing. For dry-matrix verification, specimens undergo vacuum oven drying at 80 °C under 10 mbar pressure for 16 hours, followed by desiccator cooling to prevent ambient moisture re-absorption prior to balance measurements.
The list below details key physical mechanisms that introduce measurement errors during polymer pellet density determinations:
- Internal Microvoid Formation during underwater pelletization introduces trapped gas pockets that systematically understate true resin density during hydrostatic weighing.
- Surface Moisture Adsorption on hygroscopic polymer pellets increases measured sample mass prior to immersion without altering particle volume proportionally.
- Thermal Expansion Discrepancy between test specimens and uncalibrated immersion liquids shifts liquid density parameters faster than solid polymer matrices.
- Solvent Absorption Kinetic Effects occur when non-polar hydrocarbon media like n-heptane penetrate amorphous resin phases during extended testing windows.
Testing unconditioned hygroscopic polymers produces erratic density readouts that trigger false non-compliance flags during customs enforcement audits. Documenting moisture content via Karl Fischer titration alongside ISO 1183 testing ensures that mass changes caused by water absorption are accounted for during official classification assessments.
Customs authorities reclassify polyolefin consignments when regional testing temperature variations are omitted from official certificates of analysis.
It remains uncertain whether international customs authorities will accept cryo-milling specimen preparation as a binding standard when resolving disputes over microvoided pellet shipments.

Dispute
Border administrative challenges arise when customs laboratory determinations conflict with factory certificates of analysis. When port authorities reclassify an incoming plastic consignment based on official sample testing, importers face immediate commercial liability. Tariff shortfalls, back duties, compound interest penalties, and customs hold charges accumulate while the technical origin of the analytical discrepancy is investigated.
Resolving these challenges demands a systematic audit of testing protocols, calibration certificates, sample handling logs, and physical specimen preparation methods across both origin and destination laboratories.
Customs testing protocols typically start with composite sampling from arrived containers or bulk railcars. Customs inspectors pull random pellet samples according to ISO 582 or national sampling schemes, sealing specimens in tamper-evident bags for dispatch to central revenue laboratories. If the central laboratory performs ISO 1183-1 hydrostatic testing on raw intact pellets containing internal micro-voids, the measured density will undercut the manufacturer’s plaque-molded certificate of analysis figure.
Customs Re-Testing Audits and Border Interception Workflows
Port authorities intercept plastic resin import consignments when preliminary screening density measurements diverge from entry documentation. The legal challenge process requires the importer to submit a formal administrative protest accompanied by a comprehensive technical re-testing dossier within statutory timeframes. This dossier must demonstrate that the customs laboratory’s analytical result suffered from specific procedural flaws, such as fluid temperature drift, micro-bubble attachment, or specimen voiding artifacts.
Re-testing requests demand executing parallel analysis at an independent ISO 17025 accredited laboratory, using mutually agreed specimen preparation methods. Standardized plaque compression molding under ISO 293 serves as the referee specimen preparation route, eliminating pellet geometry differences, surface roughness variations, and internal void errors. Comparing plaque-molded specimen results against intact pellet measurements demonstrates whether the original customs finding resulted from specimen preparation artifacts rather than true polymer matrix differences.
The table below compares the primary ISO 1183 test methodologies, highlighting their analytical precision, vulnerability to operational errors, and suitability for customs dispute defense:
| Test Method | Primary ISO Standard | Analytical Precision | Primary Failure Mode | Dispute Defense Value |
|---|---|---|---|---|
| Hydrostatic Immersion | ISO 1183-1 Method A | ± 0.0005 g/cm³ | Air bubble adhesion; wire meniscus drag | High; universal international reference method |
| Liquid Pycnometry | ISO 1183-1 Method B | ± 0.0008 g/cm³ | Temperature expansion; capillary filling errors | Medium; best for powders, flakes, and regrind |
| Density Gradient Column | ISO 1183-2 Method A | ± 0.0001 g/cm³ | Convection currents; float drift; thermal instability | Very High; maximum precision for solid specimens |
| Gas Pycnometry | ISO 1183-3 (Helium) | ± 0.0002 g/cm³ | Closed internal voids; gas thermal expansion | High; rapid automated screening verification |

ISO 17025 Metrological Traceability and Technical Audit Dossiers
Defending a declared customs tariff classification requires comprehensive analytical proof from accredited testing facilities. A robust technical audit dossier submitted to border authorities must contain specific, unassailable documentation items proving metrological traceability to international standards.
The dossier opens with certified calibration certificates for analytical balances, proving scale sensitivity to 0.1 milligrams alongside certified balance calibration mass sets traceable to national metrological institutes. Environmental logs confirm that ambient testing conditions maintained ISO 291 standard atmosphere settings of 23.0 °C ± 1.0 °C and 50% ± 5% relative humidity throughout sample handling and weighing sequences. Fluid temperature calibration logs demonstrate that Pt100 temperature sensors held the immersion bath within ±0.05 °C, applying dynamic liquid density corrections in accordance with certified water density tables.
Pycnometer and gradient column verification logs document fluid calibration steps, surfactant dosage calculations, and reference float settling curves. Specimen preparation records verify that test samples underwent compression molding under ISO 293 cooling conditions, removing thermal history and internal voids. Finally, independent chemical verification tests, including ash content analysis under ISO 3451 and melt flow rate determinations under ISO 1133, confirm that inorganic filler content and molecular structure match declared entry line specifications.
Importers who submit fully documented testing dossiers incorporating plaque molding protocols, fluid density corrections, and double-pycnometer cross-validation successfully defend their declared Harmonized System tariff positions during border audits.