Uncertainty Budgeting for Non Contact Optical Metrology of High Aspect Elastomeric Cavity Replicas
Uncertainty budgeting for optical metrology of elastomeric cavity replicas requires accounting for optical penetration depth, cure shrinkage, and extraction strain.


Depth
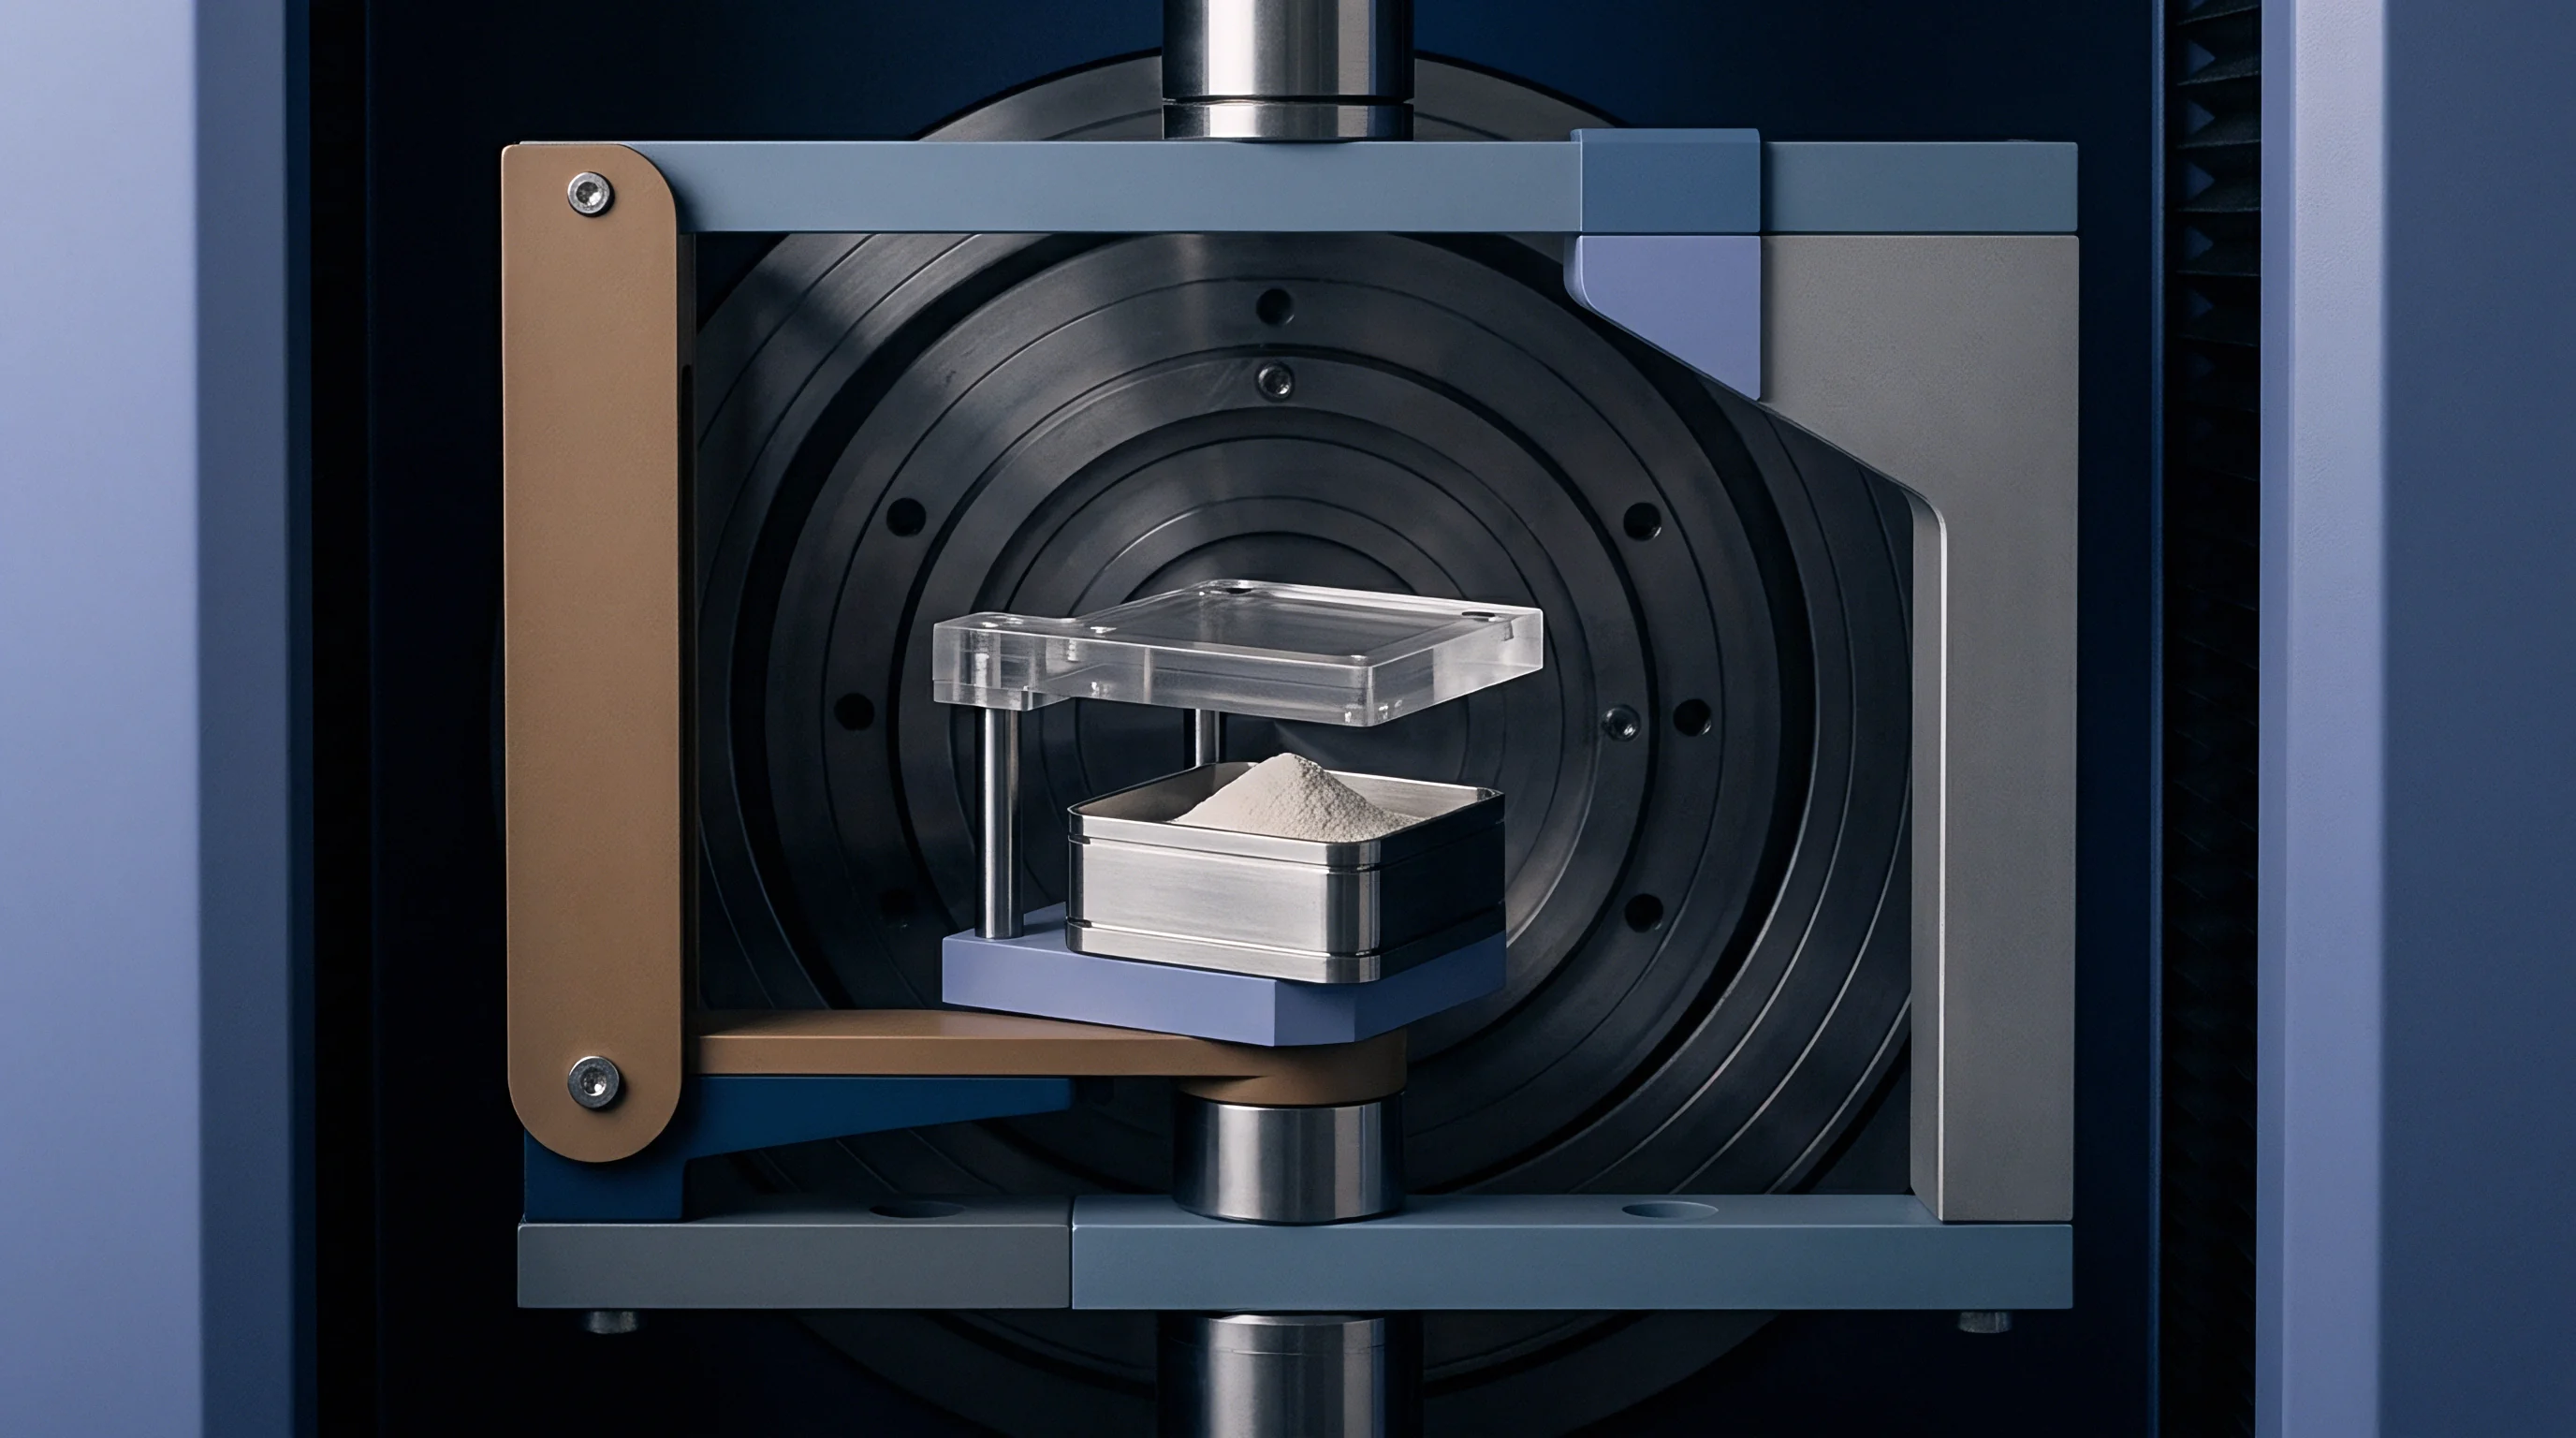
Indirectly measuring hidden tool features relies on elastomeric impressions to transfer internal cavity geometry into a measurable positive form. When internal channels, rib slots, or cooling passages present height-to-width aspect ratios exceeding five to one, direct optical probing hits mechanical and photometric limits. Tool steel blocks non-contact light paths entirely, so liquid polymer precursor mixtures must be poured into the narrow recesses, fully crosslinked, and mechanically extracted for tabletop optical scanning.
Viscous flow in high-aspect slots easily traps micro-air bubbles at sharp internal radii. Without vacuum assistance, resin mixtures with viscosities above 3000 millipascal-seconds cannot reach the roots of internal features. Air trapped at the apex of a narrow rib replica truncates the recorded profile height, creating a negative dimensional offset before scanning even begins.
Degassing the two-part silicone fluid at 30 millibars under vacuum before dispensing prevents voids along high-aspect walls.
Aspect Ratio Limits in Internal Cavity Replication
Geometric access limits whether non-contact sensors capture useful point clouds along deep sidewalls. As a cavity slot narrows relative to its depth, the angle available for specular and diffuse reflection shrinks. Standard optical profilometers with chromatic confocal probes or focus variation sensors depend on specific numerical aperture cones to collect returned photons.
Narrow slots block the high-angle reflected rays required for surface reconstruction. When an aspect ratio exceeds ten to one, sidewall slopes steeper than 75 degrees reflect too little light back to the detector array. This leaves point clouds with missing wall data, noise spikes, or artificial corner rounding where algorithms interpolate across dead measurement zones.
Optical Shadowing and Illumination Angle Deficits
Non-contact optical instruments depend on specific focal illumination geometries. Vertical light beams traveling down high-aspect replica channels shadow heavily along vertical sidewalls and undercuts. Ribbing with zero or negative draft angles cuts off direct line-of-sight light to the root radius of the cast impression.
A focus variation system operating with a 0.5 numerical aperture objective loses surface point reconstruction on replica sidewalls steeper than 62 degrees relative to the horizontal datum.
Light intensity drops quickly inside deep, narrow slots. The sensor camera receives a low signal-to-noise ratio, generating high-frequency surface noise that skews peak-to-valley profile values. Coaxially illuminated chromatic confocal sensors reduce sidewall shadowing down to fifteen millimeters deep, as long as the surface tilt stays within the objective lens acceptance cone.
Dimensional discrepancies on cavity replicas can stem from sensor calibration drift as well as optical extinction inside narrow high-aspect slots.

Refraction
Light passing through a transparent or semi-translucent polymer matrix does not stop cleanly at the outer surface. Unpigmented room-temperature-vulcanizing silicones and polyether compounds remain somewhat translucent. When an optical measurement beam hits a translucent replica, photons penetrate the surface before scattering back toward the detector.
This subsurface scattering places the apparent focal plane beneath the actual physical surface. Processing algorithms detect the center of optical intensity inside the polymer bulk rather than on its boundary, introducing systematic errors of two to twenty micrometers depending on material formulation and light wavelength.

How Does Subsurface Scattering Skew Optical Focal Planes?
Photons entering translucent silicone pass through local density gradients before scattering back out through the surface. Blue light at 450 nanometers penetrates less deeply than a red laser at 658 nanometers, leading to inconsistent height readings across different optical head designs.
| Replica Material Grade | Pigment Additive Level | Refractive Index (nD) | Optical Penetration Bias (µm) | Focus Variation Edge Error (µm) |
|---|---|---|---|---|
| Transparent RTV Silicone | 0.0% Mass Fraction | 1.406 | 18.4 | 22.1 |
| Semi-Translucent Polyether | 0.5% TiO2 Mass Fraction | 1.432 | 5.2 | 7.8 |
| Opaque PVS Elastomer | 3.0% Carbon/Pigment Blend | 1.458 | 0.6 | 1.1 |
| High-Density Silicone Composite | 5.0% Metallic Oxide Filler | 1.481 | 0.2 | 0.4 |
Height errors shift with the beam’s angle of incidence. On steep sidewalls, asymmetric scattering distorts the image laterally and shifts measured edges. This lateral bias distorts width measurements on narrow rib replicas, leading inspectors to misread internal slot geometries.

Pigment Loading and Refractive Index Calibration
Opaque casting polymers prevent subsurface scattering by stopping beam penetration within the first hundred nanometers of the surface layer. Formulating polyvinylsiloxane materials with high mass fractions of titanium dioxide or carbon pigment increases absorption and stabilizes the reflected path.
Adding pigment changes the uncured viscosity and final Shore hardness of the replica. Heavy pigment loading thickens the precursor, making micro-bubbles harder to dislodge from narrow cavity tips. Finding the maximum pigment level requires balancing optical opacity against fluid flow.
- Polyvinylsiloxane Opacification incorporates microscopic metal oxide particles that arrest subsurface photon diffusion without compromising volumetric cure stability.
- Refractive Index Matching aligns the optical index of filler particles with the polymer matrix to suppress internal Rayleigh scattering.
- Surface Coating Vaporization deposits a nanometer-thin titanium layer via physical vapor deposition onto translucent replicas, creating an opaque optical barrier.
- Wavelength Optimization shifts the optical source to violet light (405 nanometers) to maximize surface absorption efficiency.
The main challenge remains verifying whether optical coating layers maintain uniform thickness across 20-to-1 aspect ratio root radii without filling in fine surface texture.


Strain
Stripping flexible elastomeric impressions from rigid tool steel cavities subjects the replica to localized tension, shear, and compression. Deep features generate substantial surface friction against cavity walls during extraction. Pulling a 10-to-1 aspect ratio silicone rib out of a hardened steel slot stretches the elastomer along its longitudinal axis.
Elastic deformation during removal causes immediate lengthening, followed by a slower viscoelastic recovery phase. Measuring a replica right after demoulding catches it before relaxation is complete, giving inaccurate length and draft angle readings. The polymer needs a set dwell period after demoulding to settle back to equilibrium dimensions.
- Demould the cured elastomeric replica from the cavity using vertical, un-tilted pulling fixtures.
- Transfer the replica immediately into a climate-controlled metrology laboratory stabilized at 20 degrees Celsius.
- Allow the replica to rest unconstrained on a low-friction fluoropolymer surface for 180 minutes to complete viscoelastic strain recovery.
- Verify ambient temperature stability within plus or minus 0.5 degrees Celsius before starting non-contact optical scanning.

Demoulding Tension and Elastic Recovery Delay
Viscoelastic recovery rates depend on crosslink density, ambient temperature, and feature thickness. Thin replica ribs under 0.5 millimeters in cross-section stabilize thermally faster than thick structural blocks, but take longer to relax mechanically.
Internal stress relaxation follows a non-linear decay curve. Measuring a high-aspect replica ten minutes after stripping produces errors three to five times larger than measurements taken after four hours of unconstrained relaxation.
Volumetric Shrinkage and Thermal Drift Vectors
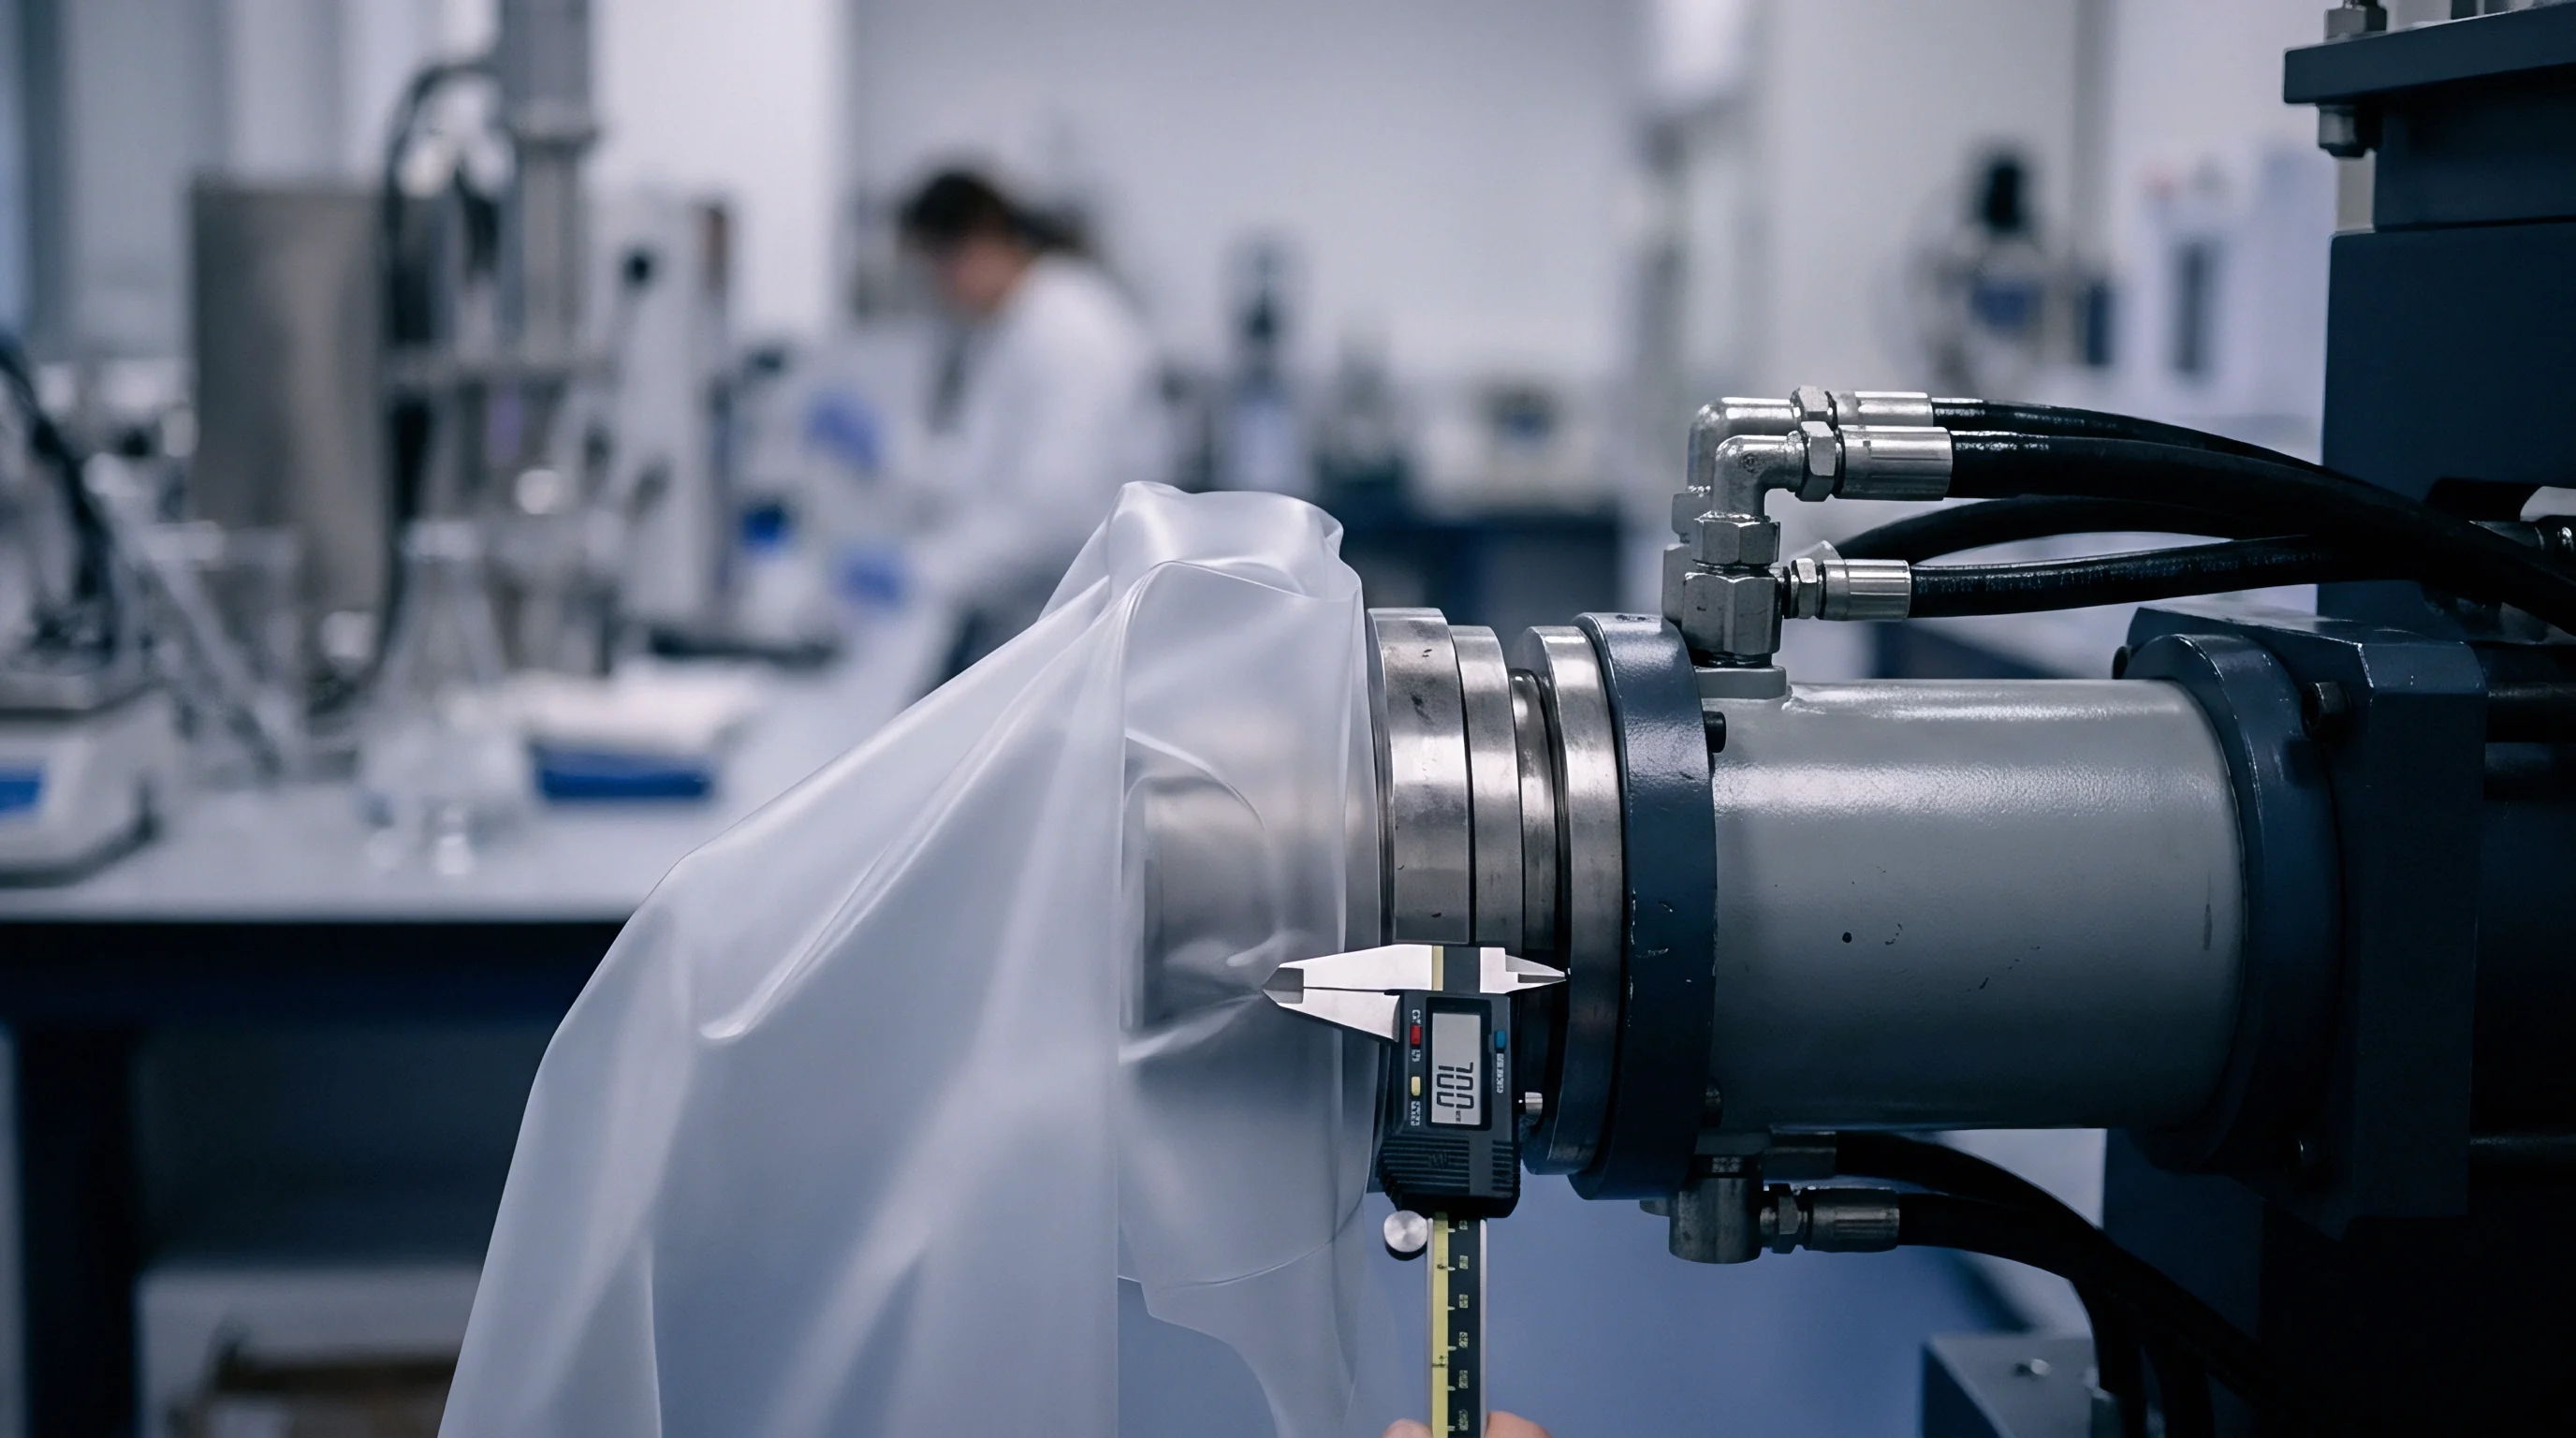
Crosslinking in two-part addition-cure silicones and polyethers rearranges molecules and reduces overall volume. Linear shrinkage values on datasheets measure unconstrained bulk material, which does not reflect behavior inside narrow, confining steel slots.
Confinement forces linear shrinkage to act asymmetrically, and because polymer curing releases heat, radial shrinkage along a narrow rib’s thickness differs significantly from axial shrinkage along its length.
According to DIN 16742 guidelines, unconstrained linear shrinkage factors applied to geometrically confined elastomeric replicas generate systematic dimensional errors exceeding 0.15 percent of total feature length.
Thermal expansion mismatches compound curing shrinkage. Tool steel has a coefficient of thermal expansion near 11.5 multiplied by 10 to the minus sixth per degree Celsius, while silicone elastomers sit near 300 multiplied by 10 to the minus sixth per degree Celsius. A five-degree difference between press-side steel and lab air creates volumetric drift that alters cavity measurements.
Skipping thermal equilibrium or applying inaccurate shrinkage factors leads to wrong tool corrections and costly re-machining.


Arithmetic
Building an ISO/IEC Guide 98-3 compliant uncertainty budget for indirect cavity metrology requires combining all Type A statistical variations with Type B systematic uncertainties from hardware, optics, and materials. Evaluating optical scans of high-aspect replicas depends on merging these separate variance components into a single expanded uncertainty figure.
Combined standard uncertainty calculations sum individual variance contributions using root-sum-square math. Sensitivity coefficients scale each physical parameter into linear units, accounting for thermal expansion, optical refraction depth errors, mechanical strain hysteresis, and baseline instrument repeatability.
Type a and Type B Uncertainty Contributions
Statistical Type A evaluations come from repeated optical scans of the same replica under constant environmental conditions. Point cloud alignment noise, sensor drift, and local mechanical vibration drive most of this variance.
Systematic Type B evaluations cover limits inherent to optical probes, material chemistry, and ambient environments. These include calibration master traceability, elastomer linear shrinkage tolerances, refractive index variations, and lateral probe resolution.
| Uncertainty Source Component | Symbol | Standard Uncertainty (µm) | Probability Distribution | Sensitivity Coefficient | Uncertainty Contribution (µm) |
|---|---|---|---|---|---|
| Optical Instrument Repeatability | u_rep | 0.45 | Normal | 1.00 | 0.45 |
| Refractive Index Penetration Bias | u_refr | 1.80 | Rectangular | 0.58 | 1.04 |
| Elastomer Linear Cure Shrinkage | u_shrink | 2.10 | Rectangular | 0.58 | 1.21 |
| Demoulding Elastic Hysteresis | u_strain | 1.50 | Normal | 1.00 | 1.50 |
| Thermal Differential (Steel vs Replica) | u_temp | 0.85 | Rectangular | 0.58 | 0.49 |
| Sensor Sidewall Slope Vignetting | u_vign | 1.20 | Triangular | 0.41 | 0.49 |

Combined Budget Matrix for High Aspect Scans
Calculating combined standard uncertainty involves squaring each scaled component, adding them together, and taking the square root of the total. Applying standard coverage factors then expands this figure to establish a confidence interval for tool verification.
For an optical chromatic confocal measurement of a 15.000 millimeter deep internal rib cavity replica with the individual standard uncertainties listed above, the combined standard uncertainty is the square root of the sum of squared contributions: 0.45 squared plus 1.04 squared plus 1.21 squared plus 1.50 squared plus 0.49 squared plus 0.49 squared, giving a combined standard uncertainty of 2.45 micrometers.
Applying a coverage factor k equals 2 defines an expanded uncertainty interval representing a 95 percent level of confidence. Multiplying 2.45 micrometers by 2 yields an expanded measurement uncertainty of plus or minus 4.90 micrometers. Measuring a feature with an engineering tolerance band of plus or minus 0.015 millimeters using this process consumes 32.7 percent of the total tolerance window in measurement uncertainty alone.
Under ISO 14253-1 decision rules for tool acceptance, guard banding reduces the usable tolerance zone by this expanded uncertainty value, keeping non-conforming cavity steel from passing quality signoff.


Proof
Signing off on complex injection molding tool steel requires proof that cavity dimensions comply with specifications before cutting metal or running trial shots. When internal geometry prevents direct touch probing with a CMM, optical scanning of elastomeric replicas provides the main empirical path for approval. High measurement uncertainty tightens the acceptable manufacturing tolerance band during first article inspection.
Clear guard-banding rules prevent approving out-of-spec tool geometry. If an internal slot drawing specifies a width of 1.000 millimeter plus or minus 0.020 millimeters, an expanded measurement uncertainty of plus or minus 0.005 millimeters restricts the tooling receipt limits to between 0.985 millimeters and 1.015 millimeters.

Tooling Acceptance Boundaries under Measurement Noise
Faced with tight guard bands, toolmakers frequently challenge metrology findings, attributing rejected dimensions to replica distortion rather than machining errors. Resolving these disputes requires a complete, audit-ready metrology dossier documenting every material and optical compensation factor used during measurement.
| Optical Sensor Technology | Max Aspect Ratio Limit | Max Measurable Sidewall Angle | Lateral Spatial Resolution (µm) | Penetration Depth Sensitivity |
|---|---|---|---|---|
| Chromatic Confocal White Light | 15:1 | 80° | 1.1 | Moderate |
| Focus Variation Microscopy | 8:1 | 65° | 0.8 | High |
| Optical Coherence Tomography (OCT) | 25:1 | 88° | 3.5 | Low |
| Laser Line Triangulation | 4:1 | 45° | 5.0 | Extreme |
Choosing the right sensor architecture directly reduces expanded uncertainty, widening the compliant acceptance zone. Combining chromatic confocal point sensors with automated precision stages outperforms line-triangulation options on deep slots.

Dossier Requirements for Production Signoff
A complete metrology dossier for cavity replica verification must document material preparation parameters, optical calibration states, and mathematical correction algorithms. Procurement teams accept cavity steel only when dossiers satisfy strict traceability criteria.
- Material Lot Traceability Certificates document precursor viscosity, batch numbers, mix ratios, and standardized linear cure shrinkage values.
- Environmental Log Documentation proves ambient temperature remained at 20 degrees Celsius plus or minus 0.5 degrees throughout cure and measurement cycles.
- Sensor Calibration Dossiers verify baseline optical probe calibration against ISO-traceable step height and optical reflectance standards.
- Guard-Band Calculation Records show explicit application of ISO 14253-1 decision rules against original component engineering drawing tolerances.
Properly constructed uncertainty budgets protect tooling investments by providing solid physical proof of cavity compliance before tool signoff. A capability ratio exceeding four to one between feature tolerance and expanded uncertainty remains the standard for tool steel signoff.