Quantification Response Factor Uncertainty Corrections for Unknown Polyolefin Non Intentionally Added Substances
Unknown polyolefin NIAS quantification relies on statistical 95th-percentile multiplicative correction factors applied against surrogate calibration standards.


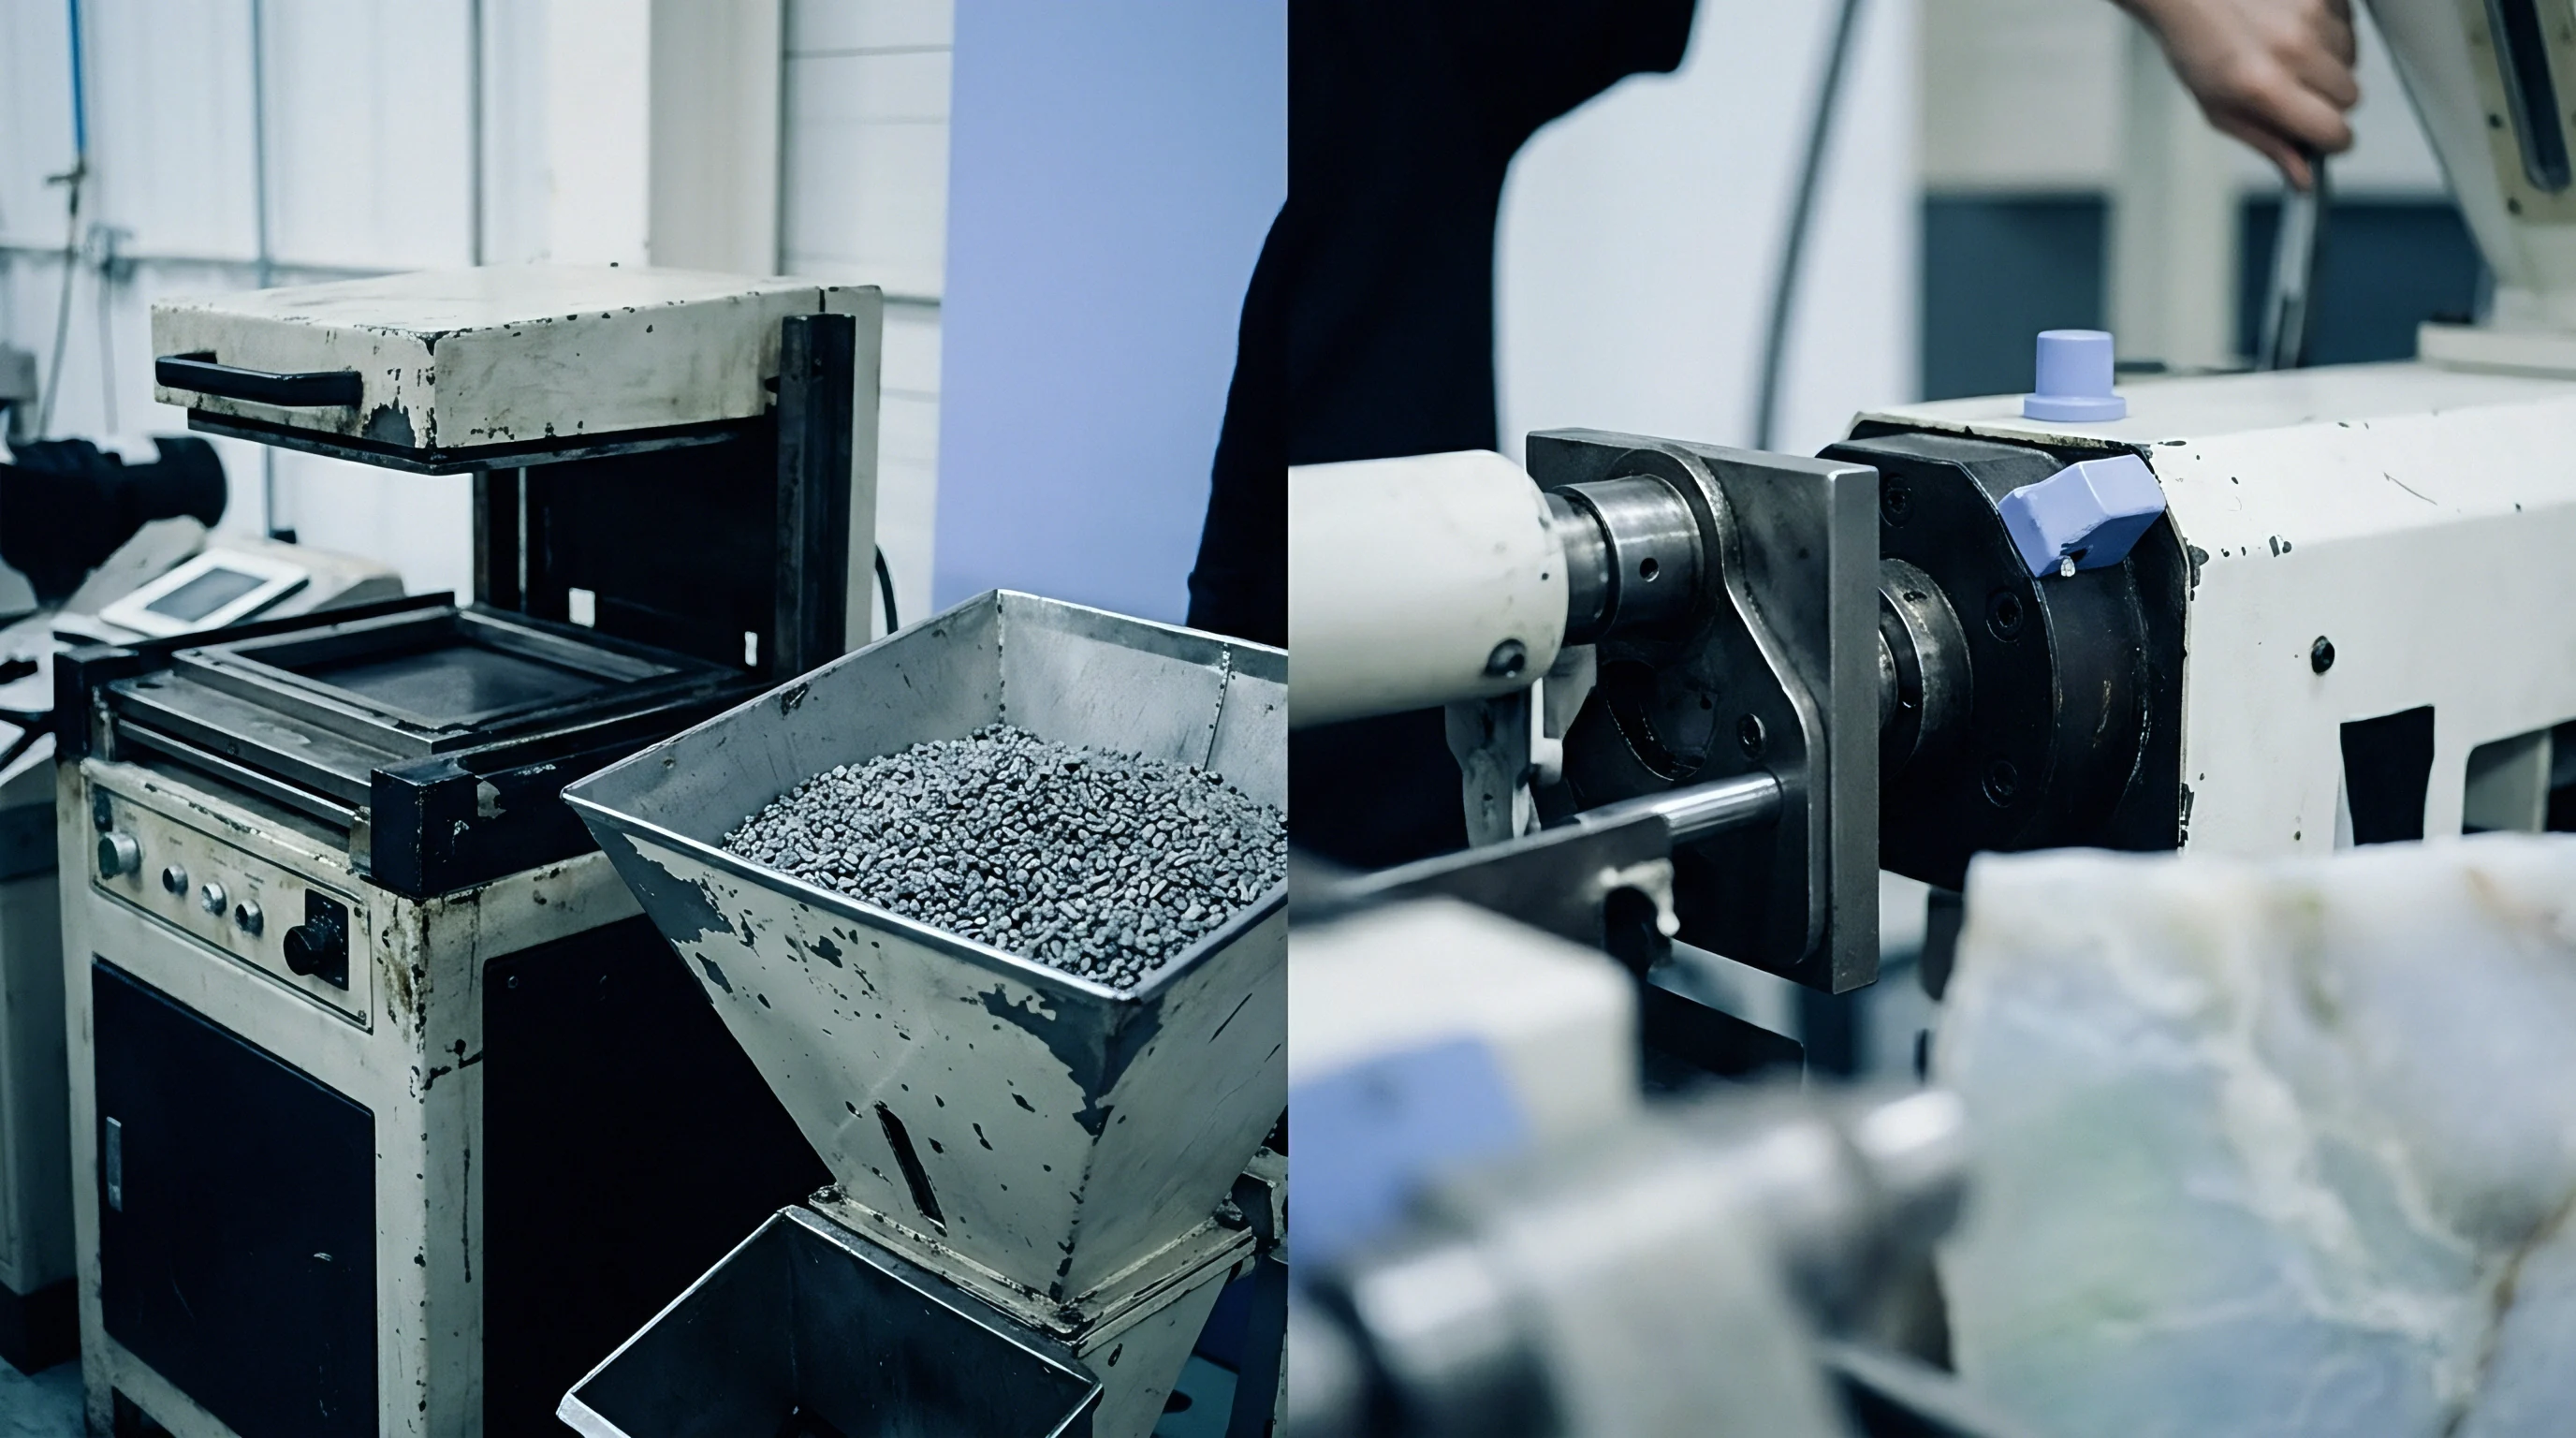
Pellet
During thermal conversion, virgin polyolefin resins are subjected to severe mechanical shearing. High-density polyethylene and polypropylene encounter temperatures from 180°C to 280°C inside extruders, blown film equipment, and injection molding units. Thermal oxidation drives free-radical cleavage across long hydrocarbon chains, while thermo-mechanical stress forms complex secondary chemical species that manufacturers do not list on raw material safety data sheets.
Alongside intended additives such as primary phenolic antioxidants, secondary phosphites, and acid scavengers, polyolefin processing generates hundreds of uncharacterized substances.
This oxidative breakdown routinely yields polar degradation products.

Polyolefin Processing and Non Intentionally Added Substance Genesis
Melt temperatures above 200°C trigger autoxidation cascades along saturated hydrocarbon backbones. Inside processing barrels, alkyl radicals combine with residual oxygen to produce alkylperoxy radicals. These reactive intermediates then abstract hydrogen atoms from neighboring polymer chains, generating hydroperoxides that cleave into alkoxy and hydroxy radicals.
Beta-scission of alkoxy radicals subsequently breaks down the polymer backbone into volatile and semi-volatile alkanes, alkenes, alkanals, alkanones, and carboxylic acids.
Antioxidants added to protect polyolefins intentionally degrade in order to preserve the polymer matrix. Hindered phenols such as pentaerythritol tetrakis(3-(3,5-di-tert-butyl-4-hydroxyphenyl)propionate) break down into quinone methides, substituted cinnamic acid derivatives, and oxidized bis-phenolic structures. Organophosphite stabilizers turn into their corresponding organophosphates as they neutralize hydroperoxides; for example, tris(2,4-di-tert-butylphenyl)phosphite oxidizes into tris(2,4-di-tert-butylphenyl)phosphate during a single extrusion pass.
Additional thermal cycles during thermoforming or scrap regrind trigger further degradation, giving rise to complex cyclic oligomers, alkylbenzenes, and functionalized aromatics.
Relative response factors across gas chromatography detectors vary by up to a factor of ten for unknown structural isomers in polyolefin extracts.

Extractable Profiles in Polyethylene and Polypropylene Matrices
Liquid extracts from high-density polyethylene consist primarily of low molecular weight alkanes. Under standard testing conditions, linear and branched aliphatic chains from C10 to C35 migrate readily into liquid food simulants. Polypropylene matrices yield a different extractable profile marked by distinct series of branched olefinic oligomers.
These propylene trimers, tetramers, pentamers, and hexamers feature methyl branches on every second carbon, creating crowded chromatograms with extensive peak overlap.
These extracts encompass wide spans of volatility and polarity. Volatile organic compounds either escape during processing or migrate quickly into dry food products. Semi-volatile organic species move steadily into fatty food simulants such as vegetable oil, 95 percent ethanol, or modified polyphenylene oxide.
Meanwhile, non-volatile compounds ~ including high molecular weight oligomers and transformation products from hindered amine light stabilizers ~ require dedicated solvent extraction before instrumental analysis.
During initial quality screenings, converters often dismiss unidentified chromatographic peaks as baseline noise.


Detector
Gas chromatography with flame ionization detection produces area counts based on carbon atom count, as the detector’s signal relies on hydrocarbon combustion to generate ions proportional to effective carbon content. Heteroatoms such as oxygen, nitrogen, and phosphorus lower this response relative to pure hydrocarbons. In electron impact mass spectrometry, molecules undergo fragmentation through fixed seventy-electron-volt kinetic collisions, where fragment ion yields vary according to molecular stability, functional group electronegativity, and ionization potential.
Ionization efficiency varies dramatically across different chemical structures.

Chromatographic Response Heterogeneity across Analytical Platforms
In liquid chromatography coupled to electrospray mass spectrometry, ionization efficiency depends strongly on analyte proton affinity and mobile phase conditions, causing yields to vary by four orders of magnitude across chemical classes. Basic nitrogenous compounds ionize readily in positive mode to produce strong signals at low mass concentrations. Conversely, neutral lipids, ester plasticizers, and hindered phenolic degradants protonate poorly, producing small peak areas for the same mass input.
Matrix interference can also shift chromatographic retention times.
Atmospheric pressure chemical ionization improves response uniformity for non-polar molecules in liquid chromatography, though significant variations persist. Flame ionization detectors keep relative response factors within a narrow twenty percent band for unbranched aliphatic hydrocarbons. By contrast, mass spectrometers using targeted electrospray ionization display relative response factors from 0.01 to 100 relative to a single surrogate calibrant.
Evaluating unknown non-intentionally added substances without correcting for these detector-specific differences leads to major quantification errors.
- Detector saturation causes non-linear peak integration when screening high-concentration polymer additives alongside trace degradation products.
- Fragment ion suppression occurs in complex polyolefin extracts when co-eluting aliphatic oligomers deplete available charge in mass spectrometer source chambers.
- Heteroatom signal attenuation causes oxygenated degradation products to show artificially small peak areas on flame ionization detectors.
- Calibration curve extrapolation creates exponential mass calculation errors when peak responses fall outside the calibrated surrogate range.

Mass Spectrometry Ionization Yield Variance
Electron impact fragmentation generates predictable ion patterns for volatile aliphatics, allowing spectral libraries to match experimental spectra against reference databases using dot-product algorithms. However, quantitative signals from total ion chromatograms depend on total fragment ion production. Functional groups that favor molecular rearrangement or form stable tropylium ions yield higher total ion counts than simple aliphatic fragments.
Effective carbon counts primarily govern flame ionization response.
High-resolution accurate mass instruments with quadrupole time-of-flight analyzers resolve co-eluting peaks through exact mass measurement. While exact mass integration enhances selectivity, molecular structure still dictates absolute response factors. Without an authentic reference standard or structural adjustment factors, a non-intentionally added substance cannot be accurately quantified by direct peak area comparison against an unmatched calibrant.
| Chemical Compound Class | GC-FID RRF vs Octadecane | GC-EI-MS RRF vs Octadecane | LC-ESI-MS RRF vs Benzophenone |
|---|---|---|---|
| Saturated Linear Alkanes (C12 to C28) | 0.98 – 1.02 | 0.85 – 1.15 | Not Ionized |
| Branched Polypropylene Trimers | 0.95 – 1.01 | 0.70 – 0.95 | Not Ionized |
| Hindered Phenol Degradants | 0.65 – 0.82 | 0.40 – 0.75 | 0.12 – 4.50 |
| Substituted Phosphite Oxides | 0.58 – 0.76 | 0.25 – 0.60 | 0.80 – 12.20 |
| Fatty Acid Amide Slip Agents | 0.82 – 0.94 | 0.50 – 0.85 | 3.10 – 28.40 |
Which detector setup offers the narrowest response factor spread when screening completely unknown polyolefin migrants?


Spike
Adding reference materials prior to extraction accounts for recovery losses during sample preparation, making internal standard selection critical to screening precision. Non-target protocols rely on surrogate standards representing various chemical classes, retention windows, and molecular weights. Deuterated or fluorine-substituted standards provide distinct mass-to-charge ratios that readily resolve from polymer extractables.
These surrogates anchor the accuracy of the quantitative dataset.

Where Does Response Factor Variation Create Quantification Error?
Uncalibrated peaks in mass chromatograms produce signals that can deviate sharply from actual concentrations. The relative response factor reflects the ratio between a target compound’s detector response and that of an internal surrogate at equal concentrations. If an unknown non-intentionally added substance has a low response factor, quantifying it directly against the surrogate understates its concentration; a high response factor does the opposite.
This response factor uncertainty easily spans an order of magnitude.
Screening studies that assign a flat response factor of 1.0 to every unidentified peak assume uniform ionization across all structures. In reality, measurements across hundreds of polyolefin extractables show that electron impact mass spectrometry response factors follow log-normal distributions spanning two orders of magnitude, while electrospray ionization response factors span up to four orders. Assuming unit response without statistical corrections introduces heavy bias into safety assessments.
Regulatory food contact compliance files that omit response factor uncertainty corrections risk rejecting safe packaging materials or approving toxicologically hazardous migrants.

Internal Standard Selection and Surrogate Mapping
Deuterated compounds assigned to specific retention windows anchor concentration estimates for related chemical families. Screening protocols divide chromatographic runs into time segments, assigning internal standards based on retention proximity. For instance, a saturated aliphatic surrogate monitors early-eluting volatile alkanes, whereas a hindered phenolic surrogate covers late-eluting additive degradants.
Mapping unknowns to the closest retention-matched surrogate narrows response factor uncertainty.
- Retention time matching pairs unidentified peaks with surrogate standards eluting within two minutes to align matrix suppression effects.
- Chemical class grouping links polar oxygenated unknowns to ester or ketone standards rather than hydrocarbon surrogates.
- Ionization mode alignment pairs positive-mode electrospray peaks with basic surrogates and negative-mode peaks with acidic ones.
- Molecular weight bracketed limits prevent high molecular weight oligomers from being calculated against low molecular weight volatile standards.
Selecting surrogates solely by retention time without considering chemical structure leads to systematic quantification errors.

Screening
Non-target screening workflows process full-scan files to identify chromatographic peaks above baseline noise. Deconvolution algorithms isolate genuine molecular ion signals from complex backgrounds, after which automated peak picking compiles candidate lists detailing retention times, accurate masses, isotopic patterns, and peak areas. Converting these peak areas into toxicologically useful concentrations requires a systematic approach to identification and uncertainty.
Standard spectral databases often miss uncommon oligomers.

Identification Confidence Levels and Structural Ambiguity
Determining empirical formulas from high-resolution exact mass signals leaves structural isomerism unresolved. The analytical community ranks identification confidence across five tiers: Level 1 confirms structures against authentic reference standards using exact mass, retention time, and tandem mass spectra; Level 2 represents probable structures based on library matches or diagnostic fragments; Level 3 identifies chemical classes or isomer groups without exact regiochemistry; Level 4 provides tentative empirical formulas from accurate mass and isotope patterns; and Level 5 covers exact mass features lacking any formula or structural assignment.
The degree of structural identification directly dictates the applicable toxicity threshold.
Uncertainty corrections depend on the confidence level achieved. Level 1 identifications eliminate response factor uncertainty altogether, as authentic standards enable multi-point linear calibration curves. Level 2 and Level 3 tentative structures allow response factor estimation via structural similarity algorithms.
For Level 4 and Level 5 unknowns, analysts must apply conservative statistical uncertainty factors derived from empirical response factor distributions.
Quantitative risk assessment of unknown migrants requires multiplying raw surrogate concentrations by a statistical correction factor to cover ninety-five percent of potential relative response factor variations.

Database Coverage Gaps for Synthetic Polymer Degradants
Commercial electron impact mass spectral libraries omit many proprietary additive breakdown products and complex cyclic oligomers. Polypropylene processing, for example, produces cyclic trimers, tetramers, and pentamers that lack commercial reference standards or library entries. Although high-resolution tandem mass spectrometry breaks these cyclic hydrocarbons into characteristic fragment series, accurate quantification remains difficult without reference materials.
Ambiguity in structural identification shrinks toxicological safety margins as estimated concentrations approach threshold limits.


Formula
Quantitative risk assessments adjust raw peak areas using dynamic correction variables. Rather than relying solely on the basic equation comparing unknown peak area against a standard’s area and concentration, accounting for response factor uncertainty introduces a multiplicative factor derived from measured response distributions.
Relying on uncorrected peak areas routinely understates toxicological exposure.

Derivation of Uncertainty Correction Factors
Statistical modeling of empirical response factor distributions defines the multiplier required for conservative safety margins. Laboratories analyze large sets of known polyolefin additives and degradants to map response factor distributions across specific detectors. The relative response factor is calculated as the test compound’s peak area over its concentration, normalized by the surrogate’s peak area over its concentration.
These distributions exhibit geometric standard deviations that capture data spread. Log-transforming the relative response factor distribution provides mean and standard deviation parameters. The uncertainty correction factor is derived from the inverse of the fifth percentile (or the ninety-fifth percentile value directly), establishing a ninety-five percent statistical confidence level that the corrected value equals or exceeds the true concentration.
Empirical GC-MS relative response factor distributions across one hundred representative polyolefin extractables demonstrate a ninety-fifth percentile uncertainty correction factor of 4.2 relative to octadecane.
- Extract the polyolefin packaging sample using approved food simulant volume ratios under specified time and temperature conditions.
- Inject the concentrated extract into the calibrated chromatographic mass spectrometry platform alongside internal surrogate standards.
- Integrate peak areas for all identified target analytes and unidentified non-target peaks exceeding the analytical report threshold.
- Calculate raw apparent concentrations for unknown peaks by direct proportion against the assigned retention-window surrogate standard.
- Apply the structural uncertainty correction factor to raw apparent concentrations based on the candidate peak identification confidence level.
- Compare corrected concentration values against specific migration limits or toxicological threshold of concern values.

Worked Exposure Derivation and Specific Migration Threshold Testing
Consider a ten percent ethanol extract evaluated after ten days at forty degrees Celsius. An unidentified semi-volatile non-intentionally added substance elutes near an octadecane internal standard. Spiked at 1.0 milligram per kilogram of simulant, octadecane produces a peak area of 500,000 counts, whereas the unknown peak yields 100,000 counts.
Direct proportion yields an apparent concentration of 0.20 milligrams per kilogram of simulant. Based on a standard surface-to-volume ratio of six square decimeters per kilogram of food, this translates to a migration value of 0.20 milligrams per kilogram of food. Without structural identification, the compound falls under Cramer Class III or the default non-genotoxic threshold of toxicological concern of 0.09 milligrams per person per day ~ equivalent to 0.015 milligrams per kilogram of food for a sixty-kilogram adult consuming one kilogram of packaged food daily.
Applying the empirical ninety-fifth percentile gas chromatography mass spectrometry uncertainty factor of 4.2 adjusts this figure. Multiplying 0.20 by 4.2 gives a corrected concentration of 0.84 milligrams per kilogram of food. This exceeds the 0.015 milligram per kilogram threshold by a factor of fifty-six, illustrating how the uncorrected figure hid a major compliance breach.
| Quantification Strategy | Assumed RRF | Apparent Concentration (mg/kg) | Corrected Concentration (mg/kg) | TTC Threshold Limit (mg/kg) | Compliance Status |
|---|---|---|---|---|---|
| Uncorrected Unit Response | 1.00 | 0.20 | 0.20 | 0.015 | Non-Compliant |
| Mean Distribution Factor | 0.72 | 0.20 | 0.28 | 0.015 | Non-Compliant |
| 90th Percentile Conservative | 0.31 | 0.20 | 0.65 | 0.015 | Non-Compliant |
| 95th Percentile Conservative | 0.24 | 0.20 | 0.84 | 0.015 | Non-Compliant |
| 99th Percentile Max Bound | 0.08 | 0.20 | 2.50 | 0.015 | Non-Compliant |
| Calculations based on 10% ethanol extract, spiked octadecane standard (1.0 mg/kg), TTC Cramer Class III limit (0.015 mg/kg food). | |||||
Supply contracts should specify clear analytical protocols for response factor uncertainty corrections across all non-target screening deliverables.


Ledger
Compliance documentation establishes the analytical scope and toxicological assessments behind food contact materials. Article 19 of European Regulation 10/2011 requires risk assessments for substances omitted from the Union list of authorized monomers and additives. Packaging converters and food packers depend on these analytical dossiers to support declarations of conformity during regulatory audits.
Without rigorous corrections, calculated safety margins quickly collapse.

Declaration Scope Verification and Analytical Dossier Auditing
Declarations of conformity provide legal guarantees from resin compounders to packaging converters. Auditing a compliance dossier involves checking raw mass spectra, peak integration settings, surrogate selections, and applied uncertainty factors. Standard test reports that simply state non-detectable results without specifying limits of detection or quantification fail to pass legal scrutiny.
Incomplete documentation risks immediate rejection by customs inspectors.
Auditors check whether screening protocols covered both volatile and non-volatile fractions. Assessing a polypropylene container with gas chromatography alone leaves non-volatile oligomers and thermal degradants unmeasured. A thorough compliance file links screening data directly to toxicological risk evaluations, demonstrating that every substance detected above the report threshold underwent proper uncertainty correction and exposure modeling.

Enforcement Realities at European Import Borders
Port authorities intercept packaging shipments when analytical files lack defensible quantitative corrections for non-intentionally added substances. National enforcement laboratories screen imported articles using high-resolution mass spectrometry; if unquantified cyclic oligomers or aromatic amines exceed action thresholds, border authorities trigger rapid alerts that stop product distribution.
Defensible compliance data ultimately governs market access.
Importers face product recalls and inventory destruction when declarations of conformity rely on uncorrected screening data. Financial liability can extend upstream to resin suppliers who fail to disclose additive reaction pathways. Incorporating response factor uncertainty corrections during initial qualification safeguards brand owners against supply chain disruptions and regulatory actions.
Laboratories operating under ISO 17025 accreditation establish relative response factor database libraries for common polyolefin extractables. Documenting empirical response factor variance across specific instrument configurations provides the quantitative groundwork needed to defend non-target screening reports during regulatory reviews.